Chapter 9 Discussion
There are known knowns. These are things we know that we know. There are known unknowns. That is to say, there are things that we know we don’t know. But there are also unknown unknowns. There are things we don’t know we don’t know. Donald Rumsfeld
In this work, I aimed to combine biological and mathematical expertise in order to approach the better understanding of the TME. I approached the complexity of TME with mathematical tools applied to transcriptome data. Starting t his work, three years ago, little was know about the possibility of extracting immune signals from bulk tumor transcriptomes. In this Ph.D. project I tested the limits of detection of the immune signal from bulk transcriptomes with unsupervised methods.
9.1 Improving our knowledge of how best apply ICA to transcriptomic data
Through Chapters 3-5, I tested parameters of Independent Components Analysis to optimize it for immune signal extraction.
First publication (Chapter 3) focused on developing and computing the MSTD index. This work led to a better understanding of our methods. It also resulted in helpful observations for my further deconvolution work. So far, many authors applied ICA to transcriptomic data for separation of biological, technical and environmental factors (Teschendorff et al. 2007; Biton et al. 2014; Gorban 2007; Zinovyev et al. 2013). However, mostly theoretical works were discussing the adequate number of dimensions proposing metrics based on purely mathematical/statistical arguments (Cangelosi and Goriely 2007; Kégl, n.d.; Bro et al. 2008). In contrast, as mentioned in the publication (Chapter 3)(Kairov et al. 2017), we asked a question: which is the most informative number of components to use in the downstream analysis?.
The work on MSTD index triggered a change in my protocol towards overdecomposition of transcriptomes. Most of previous works on unsupervised deconvolution of cell types, either impose the number of sources based (\(k\)) based on previous knowledge (Repsilber et al. 2010; Ogundijo and Wang 2017; Newberg et al. 2018) or estimate is based on statistical indexes, such as Akaike information criterion (AICc) (proposed initially by Hurvich 1989, applied to estimation of number of cell types by Liebner, Huang, and Parvin (2014)), Minimum Description Length [proposed initially by Wax et al. (n.d.), applied in CAM model by Wang et al. (2016), leave-one-out cross-validation (LOOCV) (Lähdesmäki et al. 2005) and symmetric Kullback-Leibler divergence (SKLD) (Zuckerman et al. 2013) (when sources are known) or else Moffitt et al. (2015) applied a custom method testing many possible dimensions. To my knowledge, no previous work employes the overdecomposition approach to solving the problem of the unknown number of cell types, the methods mentioned above of \(k\) estimation propose a lower number of dimensions (in the range 5-20).
9.2 Confronting ICA with other matrix factorization approaches
With my application of this protocol to six breast cancer transcriptomic datasets, I validated a hypothesis that ICA can extract reproducible signals from breast cancer transcriptomes and that some of those signals can be consequently labeled as cell-types (Chapter 4). In my additional work, I compared ICA and NMF algorithms showing that ICA breast cancer transcriptomes decomposition results in more interpretable readout (Chapter 5). NMF and ICA were systematically compared in other fields of application (i.e., image deconvolution (Mirzal 2017), web mining (Chikhi, Rothenburger, and Aussenac-Gilles 2007); physiological signal processing (Tresch, Cheung, and D’avella 2006); face recognition (Rajapakse and Wyse, n.d.)) with the outcome depending on the context. On the topic of gene expression, little works compare NMF and ICA in a systematic study. Some authors claim the similar performance of both algorithms(Kong, Mou, and Hu 2011; Schachtner et al. 2008), some assume that NMF is better suited for biological data because of the non-negativity assumption (Li and Xie 2013), other proved ICA not to recover cell states in the specific context (Sokol et al. 2015) other discussed the outperformance of ICA over PCA (Teschendorff et al. 2007). My findings are consistent with the more extensive comparison of Cantini, Kairov, et al. (2018) from our group. Despite this result, no categorical statement on the superiority of ICA over NMF can be made. ICA and NMF differ in the mathematical approach, and its efficiency might be highly context-dependent. Some recent works on ICA indicate that the performance of an algorithm can be strikingly different when applied to simulated and real data (Ablin, Cardoso, and Gramfort 2018). Thus different flavors of NMF and ICA should also be tested on real experimental data taking into account user-friendliness, the speed, and interpretability.
9.3 Deconvolution methods overall impact and utility
In Chapter 6, I implemented the methods used in the previous studies in a well-documented tool. It was an essential part of this work to make it reproducible and freely accessible to any researcher. I demonstrated that ICA is able to separate immune cell-types in blood transcriptomes with a competitive performance.
To put it in the context, in the introduction of Chapter 2, I presented a wide array of deconvolution tools (Table 2.1). It can be observed that the field evolves impressively fast, and competition is fierce. It would be interesting to measure the direct impact of each of the tool on the immunobiology field and percentage of the progress in immunotherapies due to the deconvolution methods. What can be observed, it is the number and type of citations (columns pop.index and citations Tab. 2.1). For most of the methods published in theory-focused journals, they are rarely cited in biological works using the method. All in all, without doubts CIBERSORT (Newman et al. 2015), met the most significant success, not only thanks to the solid scientific basis, extensive validation, and high impact journal but probably also because of the user-friendly web interface and simplicity (from the user perspective). Even though newer tools argue its accuracy for RNA-seq data (Li, Liu, and Liu 2017; Tamborero et al. 2018), it will probably remain the champion of the field for a long time. Which does not mean that subsequent efforts are pointless as (1) CIBERSORT is under MIT license which means any new tools based on CIBERSORT methods belong to MIT (2) there is more to explore in the TME than only cell-type abundance (3) validity of CIBERSORT (and other methods) cannot be confirmed without gold standard benchmark.
The success of CIBERSORT brings into the light another critical topic which is reproducibility crisis in research (Fanelli 2018). It is still common to find publications about software without code or online access provided. Moreover, even if thanks to community and publishers pressure it is less and less frequent (as demonstrated with numbers in Chapter 2), still it is not trivial to understand and reproduce published tools. Often documentation is not provided or floppy. Scripts deposed on a public repository are not conformed to any standards and are not tested on different operating systems and software versions. One answer to this problem could be Docker image technology (Boettiger 2014) that allows sharing a frozen environment where the tool can run, and that is not affected by user informatics environment. However, this does not replace substantial documentation and examples provided with published tools. I put my best effort to make my tool easy to use providing a tutorial and an R package following good practice guidelines with a sincere hope that users will be able to reproduce my work and build on without my extensive assistance.
As I stated in the Chapter 2, there is a schematic validation framework that is followed by many authors of deconvolution tools (i.e., Racle et al. 2017; Newman et al. 2015; Aran, Hu, and Butte 2017; Becht et al. 2016). This framework has one crucial problem: lack of gold standard validation datasets. Without a high-dimensional collection of bulk transcriptomic samples paired with an independent measure of cell-type proportions in different solid tumors, it is not possible to objectively assess the performance of published cell-type deconvolution tools. With such a benchmark it would be easier to make the field progress in the direction that can bring most benefits to immunobiology through trustful information.
9.4 Unsupervised deconvolution
I claimed that most of the tools published in the filed are using cell profiles available from the blood(Newman et al. 2015; Aran, Hu, and Butte 2017; Becht et al. 2016) and some from cancer single cell studies (Racle et al. 2017; Schelker et al. 2017). The few existing unsupervised tools (Repsilber et al. 2010; Wang et al. 2016; Gaujoux and Seoighe 2010) were not widely applied in the context of tumor transcriptomes. This work shall be the first one applying an unsupervised deconvolution framework pan-cancer with focus on cell-type deconvolution.
A crucial part of an unsupervised analysis is the data interpretation. So far most of the unsupervised methods proposed deconvolution algorithm without a method to interpret of the resulting components (Newberg et al. 2018; Wang et al. 2016). Among previous works, Repsilber et al. (2010) proposed a mapping strategy extended by Gaujoux and Seoighe (2012) and included in CellMix package (Gaujoux and Seoighe 2013). The mapping strategy consisted on computing contingency table between discovered markers (top genes of NMF metagenes) and the known lists of source markers. The proposed method is close to the Fisher exact test enrichment. The main difference is the iterative scheme that avoids repetition of labels (the same cell type attributed to many components). It would be interesting to test this approach with the signals extracted from tumor transcriptomes.
The data-driven nature of the unsupervised methods can bring unexpected results, contrasted with the more predictable behavior of supervised methods and discourage researches from experimenting with them. Gaujoux and Seoighe (2012) overcomes this issue using the semi-supervised method that guides NMF to find desired components. I followed the utterly unsupervised strategy to learn from the data possible limitations.
9.4.1 Limitations of unsupervised deconvolution
It is worth mentioning that breast cancer transcriptome was mostly used to calibrate the ICA methods as it is one of the most frequent cancers and there are publicly available datasets with large cohorts. Later results (Chapter 7) show that immune signal extracted through ICA deconvolution from breast cancer transcriptomes are the closest to the reference profiles for all three considered cell types (T cell, B cell, and Myeloid cells) and their detectability is quite high. This suggests that similar studies could not be reproduced in some cancer types, the, i.e., the T-cell signal is much further from the reference profiles (or not detectable) in colorectal cancer.
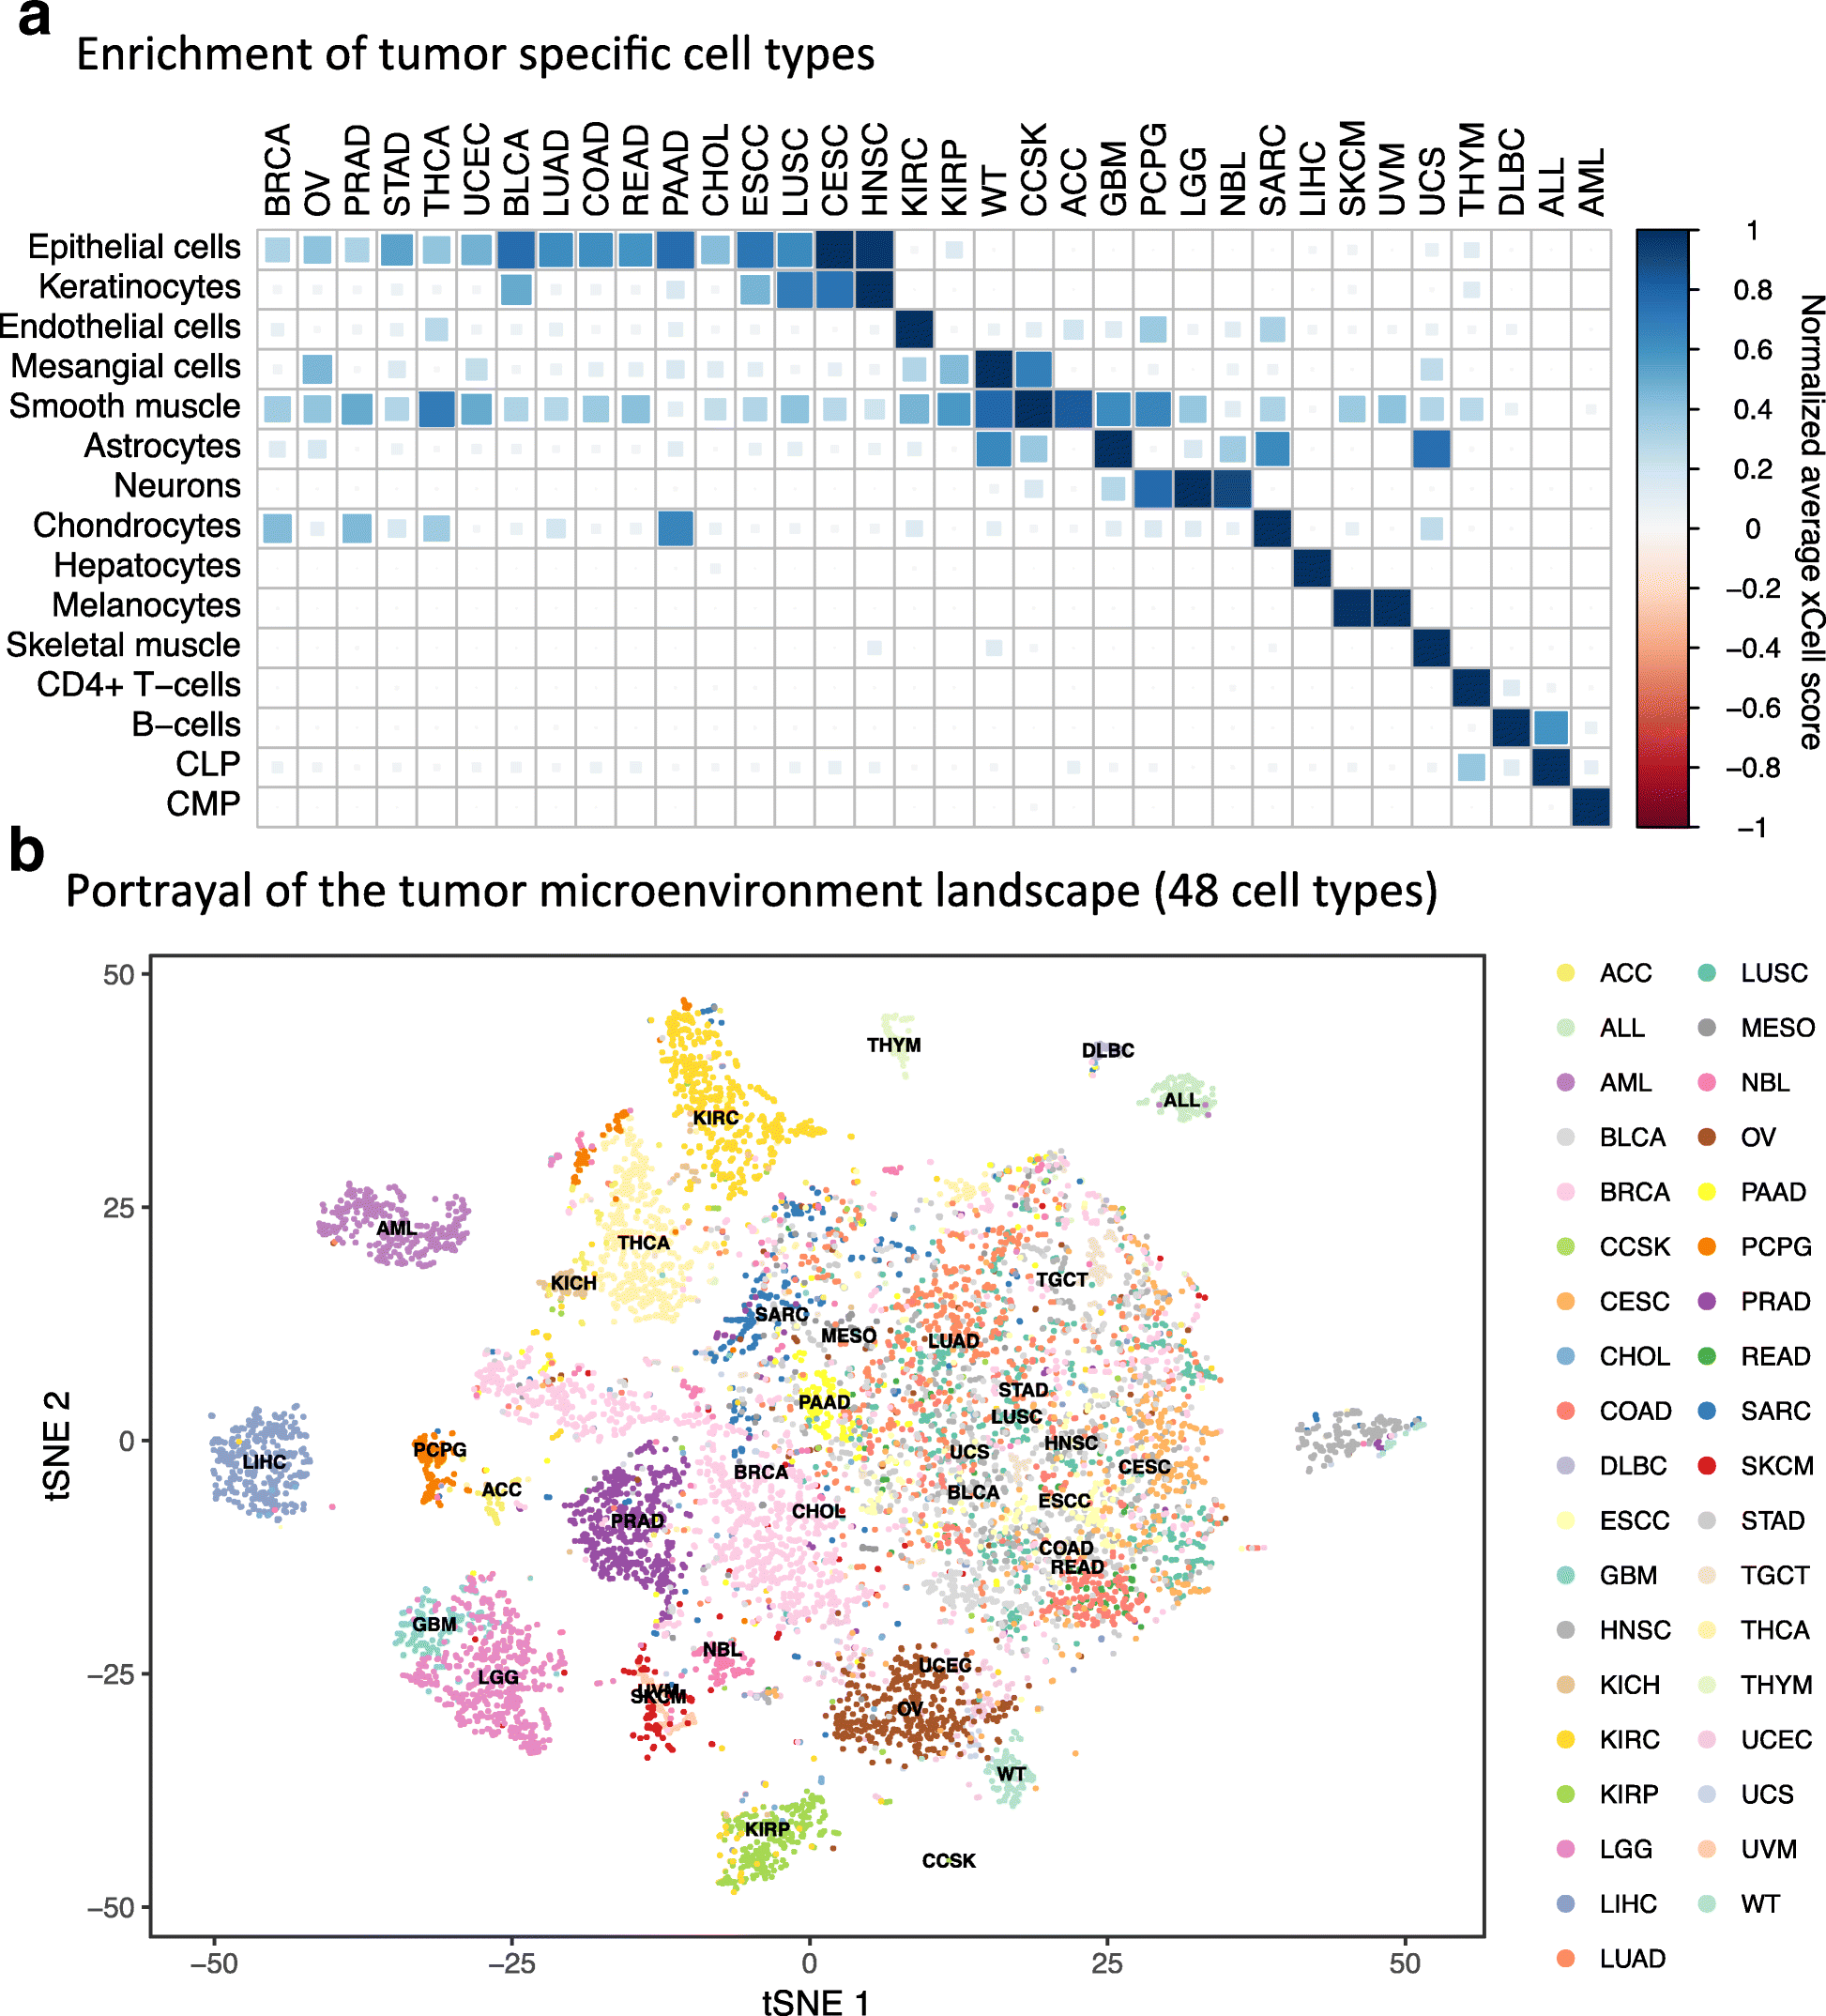
Through the application of DeconICA to various transcriptomic datasets, I observed variable detectability depending on tumor type and a number of samples. For the tumor types, some trends can be observed and interpreted. In a case of AML which immune cell-type signals were highly correlated with the reference profiles, the samples are liquid to contrast with solid tissues. Then the differences in the decomposition of solid tumors and possible biological consequences of deviation of the cell-type specific signal from the reference to be understood. The number of samples is more of technical matter. However, it is surprising that for some datasets even a low number of samples (50-90) results in meaningful signal extraction, while for some datasets with >100 samples, the decomposition can be unsuccessful. The general trend says more tumor samples, better chance to extract meaningful signals however it is not guaranteed. As the DeconICA signal extraction is data-driven and the same reference as used for all datasets, we can learn that probably use of reference genes in some tumor types may be difficult. In xCell publication (Aran, Hu, and Butte 2017), the authors applied their deconvolution tool to TCGA tumor types. Their sample space tSNE visualization (Fig. 4b) show that some tumor types samples can be clearly distinguished from other (AML, KIRC, SKCM, BRCA) and for some, it is more difficult (STAD, COAD, BLCA). This fact is not directly commented on by the authors. This result partially confirms our hypothesis that tissue type can play a role in the immune signal detectability.
Deep deconvolution should also be discussed. Shen-Orr and Gaujoux (2013) defines it as (in the context of PBMC):
accurately estimating from whole blood or PBMC sample, the proportions and expression patterns of a higher number of cell subsets, going further down into the hematopoietic tree (T-regs, naive, memory, and effector cell subsets).
Many authors (Newman et al. 2015; He et al. 2018; Aran, Hu, and Butte 2017) claimed to be able to distinguish cell subtypes from transcriptome. My results say that data-driven unsupervised deconvolution is not suited to accomplish this task. As shown in Chapter 8, I dissected the functional subgroups of the NK and Macrophages. Starting with single-cell resolution, I was able to detect groups of cells within studied cell types with distinct functional phenotype. Limited by the number of cells, the number of cell states was limited to two.
In Chapter 7, I decomposed five single-cell cancer transcriptomes: Melanoma, CRC, Breast, Liver, and Head and Neck. Applying ICA decomposition, I did not detect cell-subtypes. However, I identified cell types and common signals: cell-cycle, stress, etc. This shows the limits of the blind deconvolution methods for sub-types detection. For Liver T-cell, ICA did not detect T cell subsets. In the article describing the data (Zheng et al. 2017) authors also did not detect a strong cell subtype effect but clusters that are shared by subtypes (Fig. 2A (Zheng et al. 2017)). It is possible that gene expression profiles of immune cell sub-types are not strong enough to be detected in an unsupervised setup. ICA discovers cellular states that do not always overlap with established cell types or subtypes.
9.5 Data sources
The overall diversity of resources should also be discussed. As mentioned in Chapter 1, TCGA is the most widely used resource in pan-cancer omics studies. Main reasons are:
- accessibility
- multilevel data for the same patient
- many cancer types
- big number of patients
Studies integrating many data sources (Kairov et al. 2017; Biton et al. 2014) of different cancer types are less frequent as an additional effort is necessary, and even then the removal of technical biases is not guaranteed (Battke and Nieselt 2011). Usually, data integration poses an essential challenge in transcriptomic studies(Battke and Nieselt 2011). Different tools like Combat (Johnson, Li, and Rabinovic 2007) were developed to overcome this issue.
In hoped to overcome this issue including datasets generated with different platforms and by different research groups. In this work, I integrated data sets of published by different authors and from different technologies RNA-seq and Microarray. TCGA data were analyzed together with a corpus of datasets shared with us by Aurélien de Reynès and publicly available data. This integration was slightly less successful for the scRNA-seq as the extracted T-cell components were more correlated with each other than with any bulk-extracted components. It can be due to the different data distribution. Many tools were developed to correct single cell data for confounding effects (Wang et al. 2017; Kharchenko, Silberstein, and Scadden 2014; Yuan et al. 2017). Thanks to ICA, we can get rid of most of the batch effects as they can be discovered as an independent factor. In (Biton et al. 2014), the authors detected a particular batch effect thanks to one of the non-biological components. Therefore, ICA proposes a unique working framework that allowed me to compare signals from independently produced datasets in a single study without a need for re-normalization of the data. It was possible thanks to the use of ICA that removes the significant batch effects and the fact that the extracted from different datasets ICA components are comparable.
9.6 Missing time and space dimensions in transcriptomic studies
Despite the best research effort, the pan-cancer studies are missing some critical elements: time and space dimensions.
Most studies are based on omic data of tumor biopsies, which do not allow spatial localization of gathered information. In TCGA project pathology slides are available for a subset of patients. However, it is impossible to project the cell markers on them a posteriori or obtain gene expression from a selected area. Many studies, including (Bindea et al. 2011; Galon et al. 2016; Dieu-Nosjean et al. 2014; Sautès-Fridman et al. 2016) demonstrated that the presence of the immune cells at the invasive margin versus tumor core, or the adjacent tertiary lymphoid structures (TLS) could have a different impact on the tumor evolution and patients response to prognosis.
It is possible to estimate the abundance of some immune cells based on pathological images and also relate the patterns of cells to the patients’ survival (Saltz et al. 2018). This work can be done with an algorithm or by a pathologist. However, we cannot learn anything about the nature of the cells, cell state or functional subtype from the pathological images.
Therefore, even though most of the immunophenotyping works (Charoentong et al. 2017; Angelova et al. 2015; Thorsson et al. 2018) neglect this aspect, it is important to remember that even if we assume that we can correctly estimate cell type abundance in the sample, its impact can be confounded with spatial information.
There is a hope that with an evolution of spatial transcriptomic (Ståhl et al. 2016; Svensson, Teichmann, and Stegle 2018; Svensson, Vento-Tormo, and Teichmann 2018; Moncada et al. 2018) this gap in our knowledge will be filled in a near future.
Another crucial missing in most studies dimension is time. The immune system is a highly dynamic system. Immune cells secrete various molecules depending on stimulants coming from the surrounding tissue (endothelial cells, blood, and lymphatic vessels), tumor cells and other immune cells. Different stimuli can have additive, suppressive of synergistic effects, the order of stimuli can also matter (Touzot et al. 2014). Bergthaler and Menche (2017) compare the network of immune interactions to a social network based on collaborations and communication features.
The animal studies can profit from time resolution data, but it is linked with a sacrifice of the animal. In human studies, this approach cannot be considered. Thus, most of the patients’ samples are a snapshot at some time \(t\). With sequential biopsies (Dowlati et al. 2001; Gomez-Roca et al. 2012; Roh et al. 2017), it is possible to have several time points and observe a sort of dynamic nature of TME. Unfortunately, this kind of data is not widely available for many patients, and pan-cancer multi-omics cancer immunophenotyping remains wishful thinking.
9.7 The place of bulk transcriptomes in single cell era
Finally, I would like to discuss the place of bulk deconvolution in a single cell transcriptomic. As I mentioned before in the introduction (Chapter 1), scRNA-seq data are bringing single-cell resolution to transcriptomics, that do profit cancer immunology research (Neu et al. 2017; Giladi and Amit 2018; Papalexi and Satija 2017). This allows studying cell states and re-definition of cell types from gene expression perspective. With few cancer singe cell datasets, the scientific community learned a lot about patients and cell heterogeneity. The single cell signatures are already used in bulk deconvolution. In my work, I showed that immune cells signature extracted from a single cell are closely related to the signature extracted from the bulk transcriptomes. Due to technical challenges, scRNA-seq is not so far applied to large patient cohorts (Seymour et al., n.d.; Levitin, Yuan, and Sims 2018). It was also observed that rare cell types are not trivial to capture even with single-cell technologies and new approaches are being developed for this purpose (Torre et al. 2018). Even though scRNA-seq may one day replace the bulk RNA-seq, it will not be immediate. Till then both technologies should be used to cross-confirm findings and advance the state of our knowledge.
9.8 The field of computational cancer immunology
Despite continuous advances in research, our knowledge is limited on how tumor and immune cells interact with each other and how much this ecosystem is depending on intrinsic and extrinsic factors. The interest in the TME increased significantly over the last twenty years based on the percentage of publications dedicated to the TME. This was due mostly due to the vital breakthrough of immunotherapies. Medical advances become a motivation for many projects, mine included, to be founded and perform fundamental or applied for work on the TME. Many fundamental questions remain unanswered or controversial in the field (Zhang and Chen 2018). For example, the cell-type definition is an open issue that leads to multiple interpretations (Ediorial Cell Systems 2017). Also, the role of different compartments of TME is now considered as context-dependent (Janssen et al. 2017) which means that it is difficult to infer a clinical-level conclusion and prognosis with heterogeneous patients. The putative predictive/explanatory still await large cohort studies followed by independent validation
As discussed briefly in the Chapter 1, researchers produce more and more data (Angerer et al. 2017; Maia et al. 2017), on different scales: from molecule specific to system level which does not always directly leads to a generation of knowledge. Biological scientists need to join their efforts with analysts (mathematicians, physicists, engineers and computer scientists) to better exploit the available data, to generate the data in a smart way which would improve our understanding of complex biological systems.
Thanks to a multi-level transversal analysis of available data a few recent classifications of cancers based on TME features were proposed (Bindea et al. 2011; Charoentong et al. 2017; Thorsson et al. 2018; Tamborero et al. 2018). It remains unclear how these classifications can be brought to clinical practice in a near future and what the real impact of those studies will be on patients’ survival, diagnosis, and treatment selection. The descriptive character of the immunophenotyping lack simplicity (combination of various machine-learning-derived scores and knowledge-based curation) and it is not guaranteed to be universal (applicable to different cohorts, technologies).
Possible research directions will be discussed in perspectives.
References
Teschendorff, Andrew E., Michel Journée, Pierre A. Absil, Rodolphe Sepulchre, and Carlos Caldas. 2007. “Elucidating the Altered Transcriptional Programs in Breast Cancer using Independent Component Analysis.” PLoS Comput. Biol. 3 (8). Public Library of Science: e161. doi:10.1371/journal.pcbi.0030161.
Biton, Anne, Isabelle Bernard-Pierrot, Yinjun Lou, Clémentine Krucker, Elodie Chapeaublanc, Carlota Rubio-Pérez, Nuria López-Bigas, et al. 2014. “Independent Component Analysis Uncovers the Landscape of the Bladder Tumor Transcriptome and Reveals Insights into Luminal and Basal Subtypes.” Cell Rep. 9 (4): 1235–45. doi:10.1016/j.celrep.2014.10.035.
Gorban, A. N. (Aleksandr Nikolaevich). 2007. Principal manifolds for data visualization and dimension reduction. Springer.
Zinovyev, Andrei, Ulykbek Kairov, Tatyana Karpenyuk, and Erlan Ramanculov. 2013. “Blind source separation methods for deconvolution of complex signals in cancer biology.” Biochem. Biophys. Res. Commun. 430 (3). Academic Press: 1182–7. doi:10.1016/J.BBRC.2012.12.043.
Cangelosi, Richard, and Alain Goriely. 2007. “Component retention in principal component analysis with application to cDNA microarray data.” Biol. Direct 2. BioMed Central: 2. doi:10.1186/1745-6150-2-2.
Bro, R., K. Kjeldahl, A. K. Smilde, and H. A. L. Kiers. 2008. “Cross-validation of component models: A critical look at current methods.” Anal. Bioanal. Chem. 390 (5): 1241–51. doi:10.1007/s00216-007-1790-1.
Kairov, Ulykbek, Laura Cantini, Alessandro Greco, Askhat Molkenov, Urszula Czerwinska, Emmanuel Barillot, and Andrei Zinovyev. 2017. “Determining the optimal number of independent components for reproducible transcriptomic data analysis.” BMC Genomics 18 (1). BioMed Central: 712. doi:10.1186/s12864-017-4112-9.
Repsilber, Dirk, Sabine Kern, Anna Telaar, Gerhard Walzl, Gillian F Black, Joachim Selbig, Shreemanta K Parida, Stefan HE Kaufmann, and Marc Jacobsen. 2010. “Biomarker discovery in heterogeneous tissue samples -taking the in-silico deconfounding approach.” BMC Bioinformatics 11 (1). BioMed Central: 27. doi:10.1186/1471-2105-11-27.
Ogundijo, Oyetunji E., and Xiaodong Wang. 2017. “A sequential Monte Carlo approach to gene expression deconvolution.” Edited by Lars Kaderali. PLoS One 12 (10). Public Library of Science: e0186167. doi:10.1371/journal.pone.0186167.
Newberg, Lee A., Xiaowei Chen, Chinnappa D. Kodira, and Maria I. Zavodszky. 2018. “Computational de novo discovery of distinguishing genes for biological processes and cell types in complex tissues.” Edited by Paolo Provero. PLoS One 13 (3). Public Library of Science: e0193067. doi:10.1371/journal.pone.0193067.
Hurvich, Clifford M. 1989. “Regression and time series model selection in small samples.” Biometrika 76 (2): 297–307. https://www.stat.berkeley.edu/{~}binyu/summer08/Hurvich.AICc.pdf.
Liebner, David A., Kun Huang, and Jeffrey D. Parvin. 2014. “MMAD: microarray microdissection with analysis of differences is a computational tool for deconvoluting cell type-specific contributions from tissue samples.” Bioinformatics 30 (5). Oxford University Press: 682–89. doi:10.1093/bioinformatics/btt566.
Wang, Niya, Eric P. Hoffman, Lulu Chen, Li Chen, Zhen Zhang, Chunyu Liu, Guoqiang Yu, David M. Herrington, Robert Clarke, and Yue Wang. 2016. “Mathematical modelling of transcriptional heterogeneity identifies novel markers and subpopulations in complex tissues.” Sci. Rep. 6 (1). Nature Publishing Group: 18909. doi:10.1038/srep18909.
Lähdesmäki, Harri, llya Shmulevich, Valerie Dunmire, Olli Yli-Harja, and Wei Zhang. 2005. “In silico microdissection of microarray data from heterogeneous cell populations.” BMC Bioinformatics 6 (1). BioMed Central: 54. doi:10.1186/1471-2105-6-54.
Zuckerman, Neta S., Yair Noam, Andrea J. Goldsmith, and Peter P. Lee. 2013. “A Self-Directed Method for Cell-Type Identification and Separation of Gene Expression Microarrays.” Edited by Teresa M. Przytycka. PLoS Comput. Biol. 9 (8). Public Library of Science: e1003189. doi:10.1371/journal.pcbi.1003189.
Moffitt, Richard A, Raoud Marayati, Elizabeth L Flate, Keith E Volmar, S Gabriela Herrera Loeza, Katherine A Hoadley, Naim U Rashid, et al. 2015. “Virtual microdissection identifies distinct tumor- and stroma-specific subtypes of pancreatic ductal adenocarcinoma.” Nat. Genet. 47 (10). Nature Publishing Group: 1168–78. doi:10.1038/ng.3398.
Mirzal, Andri. 2017. “NMF versus ICA for blind source separation.” Adv. Data Anal. Classif. 11 (1): 25–48. doi:10.1007/s11634-014-0192-4.
Chikhi, Nacim Fateh, Bernard Rothenburger, and Nathalie Aussenac-Gilles. 2007. “A Comparison of Dimensionality Reduction Techniques for Web Structure Mining.” In IEEE/Wic/Acm Int. Conf. Web Intell., 116–19. IEEE. doi:10.1109/WI.2007.86.
Tresch, Matthew C, Vincent C K Cheung, and Andrea D’avella. 2006. “Simulated and Experimental Data Sets Identification of Muscle Synergies: Evaluation on Matrix Factorization Algorithms for the Downloaded from.” J. Neurophysiol., 2199–2212. doi:10.1152/jn.00222.2005.
Kong, Wei, Xiaoyang Mou, and Xiaohua Hu. 2011. “Exploring matrix factorization techniques for significant genes identification of Alzheimer’s disease microarray gene expression data.” BMC Bioinformatics 12 Suppl 5 (Suppl 5). BioMed Central: S7. doi:10.1186/1471-2105-12-S5-S7.
Schachtner, R., D. Lutter, P. Knollmüller, A. M. Tomé, F. J. Theis, G. Schmitz, M. Stetter, P. Gómez Vilda, and E. W. Lang. 2008. “Knowledge-based gene expression classification via matrix factorization.” Bioinformatics 24 (15). Oxford University Press: 1688–97. doi:10.1093/bioinformatics/btn245.
Li, Yi, and Xiaohui Xie. 2013. “A mixture model for expression deconvolution from RNA-seq in heterogeneous tissues.” BMC Bioinforma. 2013 145 14 (5). BioMed Central: S11. doi:10.1186/1471-2105-14-s5-s11.
Sokol, Ethan S., Sandhya Sanduja, Dexter X. Jin, Daniel H. Miller, Robert A. Mathis, and Piyush B. Gupta. 2015. “Perturbation-Expression Analysis Identifies RUNX1 as a Regulator of Human Mammary Stem Cell Differentiation.” Edited by Sheng Zhong. PLOS Comput. Biol. 11 (4). Public Library of Science: e1004161. doi:10.1371/journal.pcbi.1004161.
Cantini, Laura, Ulykbek Kairov, Aurelien de Reynies, Emmanuel Barillot, Francois Radvanyi, and Andrei Zinovyev. 2018. “Stabilized Independent Component Analysis outperforms other methods in finding reproducible signals in tumoral transcriptomes.” bioRxiv. Cold Spring Harbor Laboratory, 318154. doi:10.1101/318154.
Ablin, Pierre, Jean-François Cardoso, and Alexandre Gramfort. 2018. “Accelerating Likelihood Optimization for ICA on Real Signals.” In, 151–60. Springer, Cham. doi:10.1007/978-3-319-93764-9_15.
Newman, Aaron M, Chih Long Liu, Michael R Green, Andrew J Gentles, Weiguo Feng, Yue Xu, Chuong D Hoang, Maximilian Diehn, and Ash A Alizadeh. 2015. “Robust enumeration of cell subsets from tissue expression profiles.” Nat. Methods 12 (5). Nature Publishing Group: 453–57. doi:10.1038/nmeth.3337.
Li, Bo, Jun S. Liu, and X. Shirley Liu. 2017. “Revisit linear regression-based deconvolution methods for tumor gene expression data.” Genome Biol. 18 (1). BioMed Central: 127. doi:10.1186/s13059-017-1256-5.
Tamborero, David, Carlota Rubio-Perez, Ferran Muinos, Radhakrishnan Sabarinathan, Josep Maria Piulats, Aura Muntasell, Rodrigo Dienstmann, Nuria Lopez-Bigas, and Abel Gonzalez-Perez. 2018. “A pan-cancer landscape of interactions between solid tumors and infiltrating immune cell populations.” Clin. Cancer Res. American Association for Cancer Research, clincanres.3509.2017. doi:10.1158/1078-0432.CCR-17-3509.
Fanelli, Daniele. 2018. “Opinion: Is science really facing a reproducibility crisis, and do we need it to?” Proc. Natl. Acad. Sci. 115 (11): 2628–31. doi:10.1073/pnas.1708272114.
Boettiger, Carl. 2014. “An introduction to Docker for reproducible research, with examples from the R environment.” https://arxiv.org/pdf/1410.0846.pdf.
Racle, Julien, Kaat de Jonge, Petra Baumgaertner, Daniel E Speiser, and David Gfeller. 2017. “Simultaneous enumeration of cancer and immune cell types from bulk tumor gene expression data.” Elife 6. eLife Sciences Publications Limited: e26476. doi:10.7554/eLife.26476.
Aran, Dvir, Zicheng Hu, and Atul J. Butte. 2017. “xCell: digitally portraying the tissue cellular heterogeneity landscape.” Genome Biol. 18 (1). BioMed Central: 220. doi:10.1186/s13059-017-1349-1.
Becht, Etienne, Aurélien de Reyniès, Nicolas A Giraldo, Camilla Pilati, Bénédicte Buttard, Laetitia Lacroix, Janick Selves, Catherine Sautès-Fridman, Pierre Laurent-Puig, and Wolf Herman Fridman. 2016. “Immune and Stromal Classification of Colorectal Cancer Is Associated with Molecular Subtypes and Relevant for Precision Immunotherapy.” Clin. Cancer Res. 22 (16). American Association for Cancer Research: 4057–66. doi:10.1158/1078-0432.CCR-15-2879.
Schelker, Max, Sonia Feau, Jinyan Du, Nav Ranu, Edda Klipp, Birgit Schoeberl, Gavin MacBeath, et al. 2017. “Estimation of immune cell content in tumour tissue using single-cell RNA-seq data.” Nat. Commun. 8 (1). Nature Publishing Group: 2032. doi:10.1038/s41467-017-02289-3.
Gaujoux, Renaud, and Cathal Seoighe. 2010. “A flexible R package for nonnegative matrix factorization.” BMC Bioinformatics 11 (1). BioMed Central: 367. doi:10.1186/1471-2105-11-367.
Gaujoux, Renaud, and Cathal Seoighe. 2012. “Semi-supervised Nonnegative Matrix Factorization for gene expression deconvolution: A case study.” Infect. Genet. Evol. 12 (5). Elsevier: 913–21. doi:10.1016/J.MEEGID.2011.08.014.
Gaujoux, R., and C. Seoighe. 2013. “CellMix: a comprehensive toolbox for gene expression deconvolution.” Bioinformatics 29 (17): 2211–2. doi:10.1093/bioinformatics/btt351.
Shen-Orr, Shai S, and Renaud Gaujoux. 2013. “Computational deconvolution: extracting cell type-specific information from heterogeneous samples.” Curr. Opin. Immunol. 25 (5): 571–78. doi:10.1016/j.coi.2013.09.015.
He, Jing, H. Carlo Maurer, Sam R. Holmstrom, Tao Su, Aqeel Ahmed, Hanina Hibshoosh, John A. Chabot, et al. 2018. “Transcriptional deconvolution reveals consistent functional subtypes of pancreatic cancer epithelium and stroma.” bioRxiv. Cold Spring Harbor Laboratory, 288779. doi:10.1101/288779.
Zheng, Chunhong, Liangtao Zheng, Jae-Kwang Yoo, Huahu Guo, Yuanyuan Zhang, Xinyi Guo, Boxi Kang, et al. 2017. “Landscape of Infiltrating T Cells in Liver Cancer Revealed by Single-Cell Sequencing.” Cell 169 (7). Cell Press: 1342–1356.e16. doi:10.1016/J.CELL.2017.05.035.
Battke, Florian, and Kay Nieselt. 2011. “Mayday SeaSight: Combined Analysis of Deep Sequencing and Microarray Data.” Edited by Vincent Laudet. PLoS One 6 (1). Public Library of Science: e16345. doi:10.1371/journal.pone.0016345.
Johnson, W. E., C. Li, and A. Rabinovic. 2007. “Adjusting batch effects in microarray expression data using empirical Bayes methods.” Biostatistics 8 (1): 118–27. doi:10.1093/biostatistics/kxj037.
Wang, Zeya, Shaolong Cao, Jeffrey S. Morris, Jaeil Ahn, Rongjie Liu, Svitlana Tyekucheva, Fan Gao, et al. 2017. “Transcriptome Deconvolution of Heterogeneous Tumor Samples with Immune Infiltration.” bioRxiv. Cold Spring Harbor Laboratory, 146795. doi:10.1101/146795.
Kharchenko, Peter V, Lev Silberstein, and David T Scadden. 2014. “Bayesian approach to single-cell differential expression analysis.” Nat. Methods 11 (7). Nature Publishing Group: 740–42. doi:10.1038/nmeth.2967.
Yuan, Guo-Cheng, Long Cai, Michael Elowitz, Tariq Enver, Guoping Fan, Guoji Guo, Rafael Irizarry, et al. 2017. “Challenges and emerging directions in single-cell analysis.” Genome Biol. 18 (1). BioMed Central: 84. doi:10.1186/s13059-017-1218-y.
Bindea, Gabriela, Bernhard Mlecnik, Wolf-Herman Fridman, and Jérôme Galon. 2011. “The prognostic impact of anti-cancer immune response: a novel classification of cancer patients.” Semin. Immunopathol. 33 (4). Springer-Verlag: 335–40. doi:10.1007/s00281-011-0264-x.
Galon, J., B. A. Fox, C. B. Bifulco, G. Masucci, T. Rau, G. Botti, F. M. Marincola, et al. 2016. “Immunoscore and Immunoprofiling in cancer: An update from the melanoma and immunotherapy bridge 2015.” J. Transl. Med. 14 (1). doi:10.1186/s12967-016-1029-z.
Dieu-Nosjean, Marie-Caroline, Jérémy Goc, Nicolas A. Giraldo, Catherine Sautès-Fridman, and Wolf Herman Fridman. 2014. “Tertiary lymphoid structures in cancer and beyond.” Trends Immunol. 35 (11): 571–80. doi:10.1016/j.it.2014.09.006.
Sautès-Fridman, Catherine, Myriam Lawand, Nicolas A. Giraldo, Hélène Kaplon, Claire Germain, Wolf Herman Fridman, and Marie-Caroline Dieu-Nosjean. 2016. “Tertiary Lymphoid Structures in Cancers: Prognostic Value, Regulation, and Manipulation for Therapeutic Intervention.” Front. Immunol. 7. Frontiers: 407. doi:10.3389/fimmu.2016.00407.
Saltz, Joel, Rajarsi Gupta, Le Hou, Alexander J Lazar, Ashish Sharma, Tahsin Kurc, Pankaj Singh, et al. 2018. “Spatial Organization and Molecular Correlation of Tumor-Infiltrating Lymphocytes Using Deep Learning on Pathology Images Cell Reports Resource Spatial Organization and Molecular Correlation of Tumor-Infiltrating Lymphocytes Using Deep Learning on Pathology Images.” Cell Rep. 23: 181–200. doi:10.1016/j.celrep.2018.03.086.
Charoentong, Pornpimol, Francesca Finotello, Mihaela Angelova, Clemens Mayer, Mirjana Efremova, Dietmar Rieder, Hubert Hackl, and Zlatko Trajanoski. 2017. “Pan-cancer Immunogenomic Analyses Reveal Genotype-Immunophenotype Relationships and Predictors of Response to Checkpoint Blockade.” Cell Rep. 18 (1). Elsevier: 248–62. doi:10.1016/j.celrep.2016.12.019.
Angelova, Mihaela, Pornpimol Charoentong, Hubert Hackl, Maria L Fischer, Rene Snajder, Anne M Krogsdam, Maximilian J Waldner, et al. 2015. “Characterization of the immunophenotypes and antigenomes of colorectal cancers reveals distinct tumor escape mechanisms and novel targets for immunotherapy.” Genome Biol. 16 (1). BioMed Central: 64. doi:10.1186/s13059-015-0620-6.
Thorsson, Vésteinn, David L Gibbs, Scott D Brown, Denise Wolf, Dante S Bortone, Tai-Hsien Ou Yang, Eduard Porta-Pardo, et al. 2018. “The Immune Landscape of Cancer.” Immunity 48 (4). Elsevier: 812–830.e14. doi:10.1016/j.immuni.2018.03.023.
Ståhl, Patrik L, Fredrik Salmén, Sanja Vickovic, Anna Lundmark, José Fernández Navarro, Jens Magnusson, Stefania Giacomello, et al. 2016. “Visualization and analysis of gene expression in tissue sections by spatial transcriptomics.” Science 353 (6294). American Association for the Advancement of Science: 78–82. doi:10.1126/science.aaf2403.
Svensson, Valentine, Sarah A Teichmann, and Oliver Stegle. 2018. “SpatialDE: identification of spatially variable genes.” Nat. Methods 15 (5). Nature Publishing Group: 343–46. doi:10.1038/nmeth.4636.
Svensson, Valentine, Roser Vento-Tormo, and Sarah A Teichmann. 2018. “Exponential scaling of single-cell RNA-seq in the past decade.” Nat. Protoc. 13 (4). Nature Publishing Group: 599–604. doi:10.1038/nprot.2017.149.
Moncada, Reuben, Florian Wagner, Marta Chiodin, Joseph C. Devlin, Maayan Baron, Cristina H. Hajdu, Diane Simeone, and Itai Yanai. 2018. “Building a tumor atlas: integrating single-cell RNA-Seq data with spatial transcriptomics in pancreatic ductal adenocarcinoma.” bioRxiv, March. Cold Spring Harbor Laboratory, 254375. doi:10.1101/254375.
Touzot, Maxime, Maximilien Grandclaudon, Antonio Cappuccio, Takeshi Satoh, Carolina Martinez-Cingolani, Nicolas Servant, Nicolas Manel, and Vassili Soumelis. 2014. “Combinatorial flexibility of cytokine function during human T helper cell differentiation.” Nat. Commun. 5 (1). Nature Publishing Group: 3987. doi:10.1038/ncomms4987.
Bergthaler, Andreas, and Jörg Menche. 2017. “The immune system as a social network.” Nat. Immunol. 18 (5): 481–82. doi:10.1038/ni.3727.
Dowlati, A, J Haaga, S C Remick, T P Spiro, S L Gerson, L Liu, S J Berger, N A Berger, and J K Willson. 2001. “Sequential tumor biopsies in early phase clinical trials of anticancer agents for pharmacodynamic evaluation.” Clin. Cancer Res. 7 (10): 2971–6. http://www.ncbi.nlm.nih.gov/pubmed/11595684.
Gomez-Roca, C. A., L. Lacroix, C. Massard, T. De Baere, F. Deschamps, R. Pramod, R. Bahleda, et al. 2012. “Sequential research-related biopsies in phase I trials: acceptance, feasibility and safety.” Ann. Oncol. 23 (5): 1301–6. doi:10.1093/annonc/mdr383.
Roh, Whijae, Pei-Ling Chen, Alexandre Reuben, Christine N Spencer, Peter A Prieto, John P Miller, Vancheswaran Gopalakrishnan, et al. 2017. “Integrated molecular analysis of tumor biopsies on sequential CTLA-4 and PD-1 blockade reveals markers of response and resistance.” Sci. Transl. Med. 9 (379). American Association for the Advancement of Science: eaah3560. doi:10.1126/scitranslmed.aah3560.
Neu, Karlynn E, Qingming Tang, Patrick C Wilson, and Aly A Khan. 2017. “Single-Cell Genomics: Approaches and Utility in Immunology.” Trends Immunol. 38 (2). Elsevier: 140–49. doi:10.1016/j.it.2016.12.001.
Giladi, Amir, and Ido Amit. 2018. “Single-Cell Genomics: A Stepping Stone for Future Immunology Discoveries.” Cell 172 (1-2). Elsevier: 14–21. doi:10.1016/j.cell.2017.11.011.
Papalexi, Efthymia, and Rahul Satija. 2017. “Single-cell RNA sequencing to explore immune cell heterogeneity.” Nat. Rev. Immunol. 18 (1): 35–45. doi:10.1038/nri.2017.76.
Levitin, Hanna Mendes, Jinzhou Yuan, and Peter A Sims. 2018. “Single-Cell Transcriptomic Analysis of Tumor Heterogeneity.” Trends in Cancer 4 (4). Elsevier: 264–68. doi:10.1016/j.trecan.2018.02.003.
Torre, Eduardo, Hannah Dueck, Sydney Shaffer, Janko Gospocic, Rohit Gupte, Roberto Bonasio, Junhyong Kim, John Murray, and Arjun Raj. 2018. “Rare Cell Detection by Single-Cell RNA Sequencing as Guided by Single-Molecule RNA FISH.” Cell Syst. 6 (2). Elsevier: 171–179.e5. doi:10.1016/j.cels.2018.01.014.
Zhang, Hongming, and Jibei Chen. 2018. “Current status and future directions of cancer immunotherapy.” J. Cancer 9 (10): 1773–81. doi:10.7150/jca.24577.
Ediorial Cell Systems. 2017. “What Is Your Conceptual Definition of ‘Cell Type’ in the Context of a Mature Organism?” Cell Syst. 4 (3). Elsevier: 255–59. doi:10.1016/j.cels.2017.03.006.
Janssen, Louise M.E., Emma E. Ramsay, Craig D. Logsdon, and Willem W. Overwijk. 2017. “The immune system in cancer metastasis: friend or foe?” J. Immunother. Cancer 5 (1). BioMed Central: 79. doi:10.1186/s40425-017-0283-9.
Angerer, Philipp, Lukas Simon, Sophie Tritschler, F. Alexander Wolf, David Fischer, and Fabian J. Theis. 2017. “Single cells make big data: New challenges and opportunities in transcriptomics.” Curr. Opin. Syst. Biol. 4. Elsevier: 85–91. doi:10.1016/J.COISB.2017.07.004.
Maia, Ana-Teresa, Stephen-John Sammut, Ana Jacinta-Fernandes, and Suet-Feung Chin. 2017. “Big data in cancer genomics.” Curr. Opin. Syst. Biol. 4. Elsevier: 78–84. doi:10.1016/J.COISB.2017.07.007.