Chapter 1 Immuno-biology of cancer
This chapter will first introduce a short history of cancer with a focus on discoveries linking cancer and its environment. It will also describe the participation of TME in cancer development, progression and response to treatment. Most important types of data used to study cancer microenvironment will be discussed. I also introduce a link between tumor immune-biology and cancer phenotyping for development of immunotherapies.
1.1 Cancer disease
According to GLOBOCAN study (Research in Cancer 2018), 14.1 million cancer cases were estimated to happen around the world in 2012. It touched 7.4 million men and 6.7 million women. It is estimated that the cancer cases will increase almost two-fold to 24 million by 2035.
In France only, in 2012 there were 349426 cases of cancer, of which leading is Prostate cancer (16,3%) followed by Breast (14%) and Lung (11,5%).
For a long time studying tumor was focused on tumor cells, their reprogramming, mutations. Cancer was seen as a disease of uncontrolled cells by the mainstream research. At the same time, the idea of the importance of the impact of other cells and structures on cancer cells was present but often not believed. A recent success of immunotherapies moved research focus to tumor cells in their context: tumor microenvironment. We will describe here what is the composition and role of the TME in tumor progression, diagnosis and response to treatment.
1.1.1 Historical understanding of cancer
Cancer was historically described by a physician Hippocrates (460–370 B.C) (Sudhakar 2009). Even though there exist even earlier evidence of the disease. Hippocrates stated that the body contained 4 humors (body fluids): blood, phlegm, yellow bile and black bile. Any imbalance of these fluids will result in disease. Particularly the excess of black bile in an organ was meant to provoke cancer. For years, it was not known what factors cause cancer and it was easily confounded with other diseases. In the middle ages in the Renaissance Period, it was believed cancer is a punishment for the sins they committed against their god, that they deserved it to some extent.
Until the 18th century, it was believed that cancer is contagious and is spread by parasites.
In the 19th century, tumor cells started to be analyzed by pathologists. They were strike with their ability to proliferate uncontrollably, ability to spread and destroy the original tissue (NPR 2010b). Around the same time, leukocytes from the blood were first described by Gabriel Andra and William Addison. Just a few years later, in 1845 Bennett and Virchow described blood cells in leukemia (Fig. 1.1). Virchow is also a father of Chronic irritation theory (nowadays called chronic inflammation) that says that cancer is caused by local “irritation” and, incorrectly, that cancer cells spread like liquid resulting in metastasis.
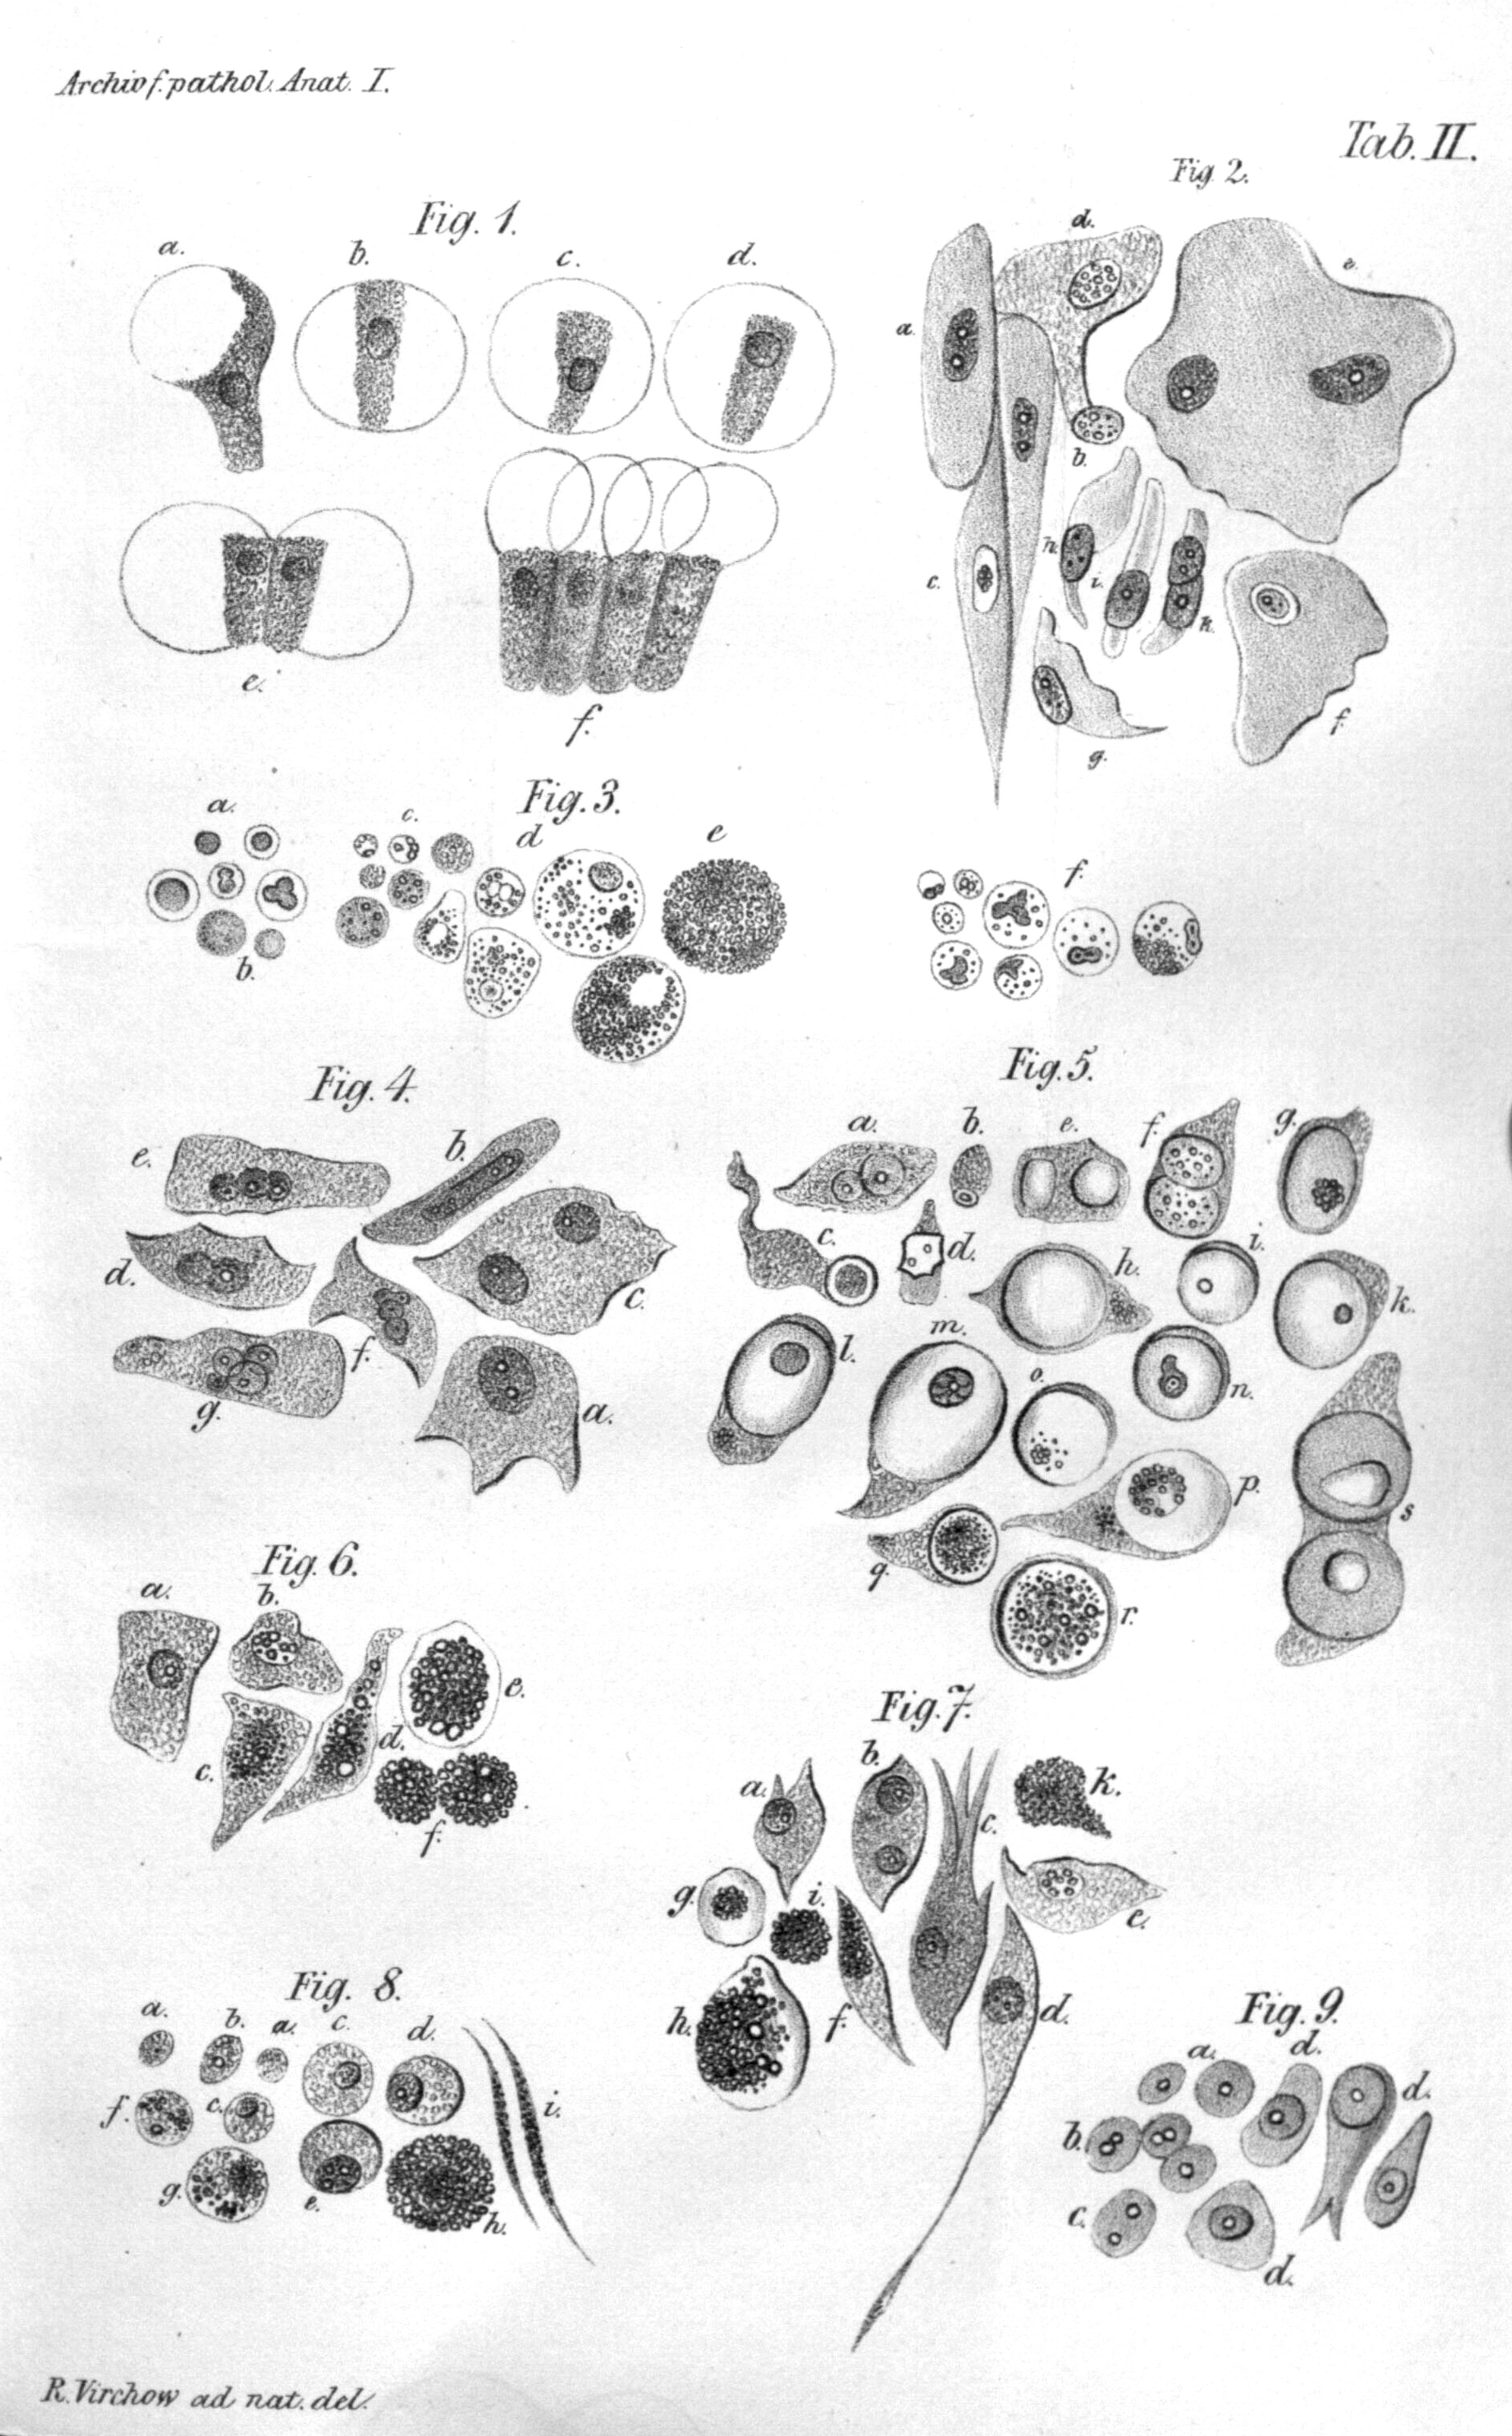
Figure 1.1: Illustration of Virchow’s cell theory. Virchow depicted different cells transformation due to irritation. (Virchow Rudolf 1847)
In 1889, Stephen Paget introduced soil and seed hypothesis of metastases (Paget 1889). He formulates it as follows
When a plant goes to seed, its seeds are carried in all directions, but they can only live and grow if they fall on congenial soil.
Which is parallel to cancer cells disseminated by body fluids, and they can grow only tissues - “soil” that is predisposed to host the cancer cell - “the seed”. He focused on the importance of tissue characteristics that favorize tumor development as opposed to most researchers of his time that were focusing on the “seed” itself.
In the 20th century, molecular causes started to be investigated. It was discovered that cancer could be caused by environmental factors, i.e. chemicals (carcinogens), radiation, viruses and also inherited from ancestors. Those factors would damage but contrary to a healthy condition they would not die.
Also in 1909, Paul Ehrlich, called one of fathers of immunology and Nobel Prize laureate, indicated a link between immune system and tumor suppression (Ehrlich 1909). One of the remarkable first immunotherapy attempts can be attributed to William Coley, that practiced injecting streptococcus bacteria directly into patients after cancer surgery in 1891, later called “Colley vaccine”. However, the impact of this procedure on patients recovery was judged by scientific community as “unclear”.
In 1968, Melvin Greenblatt and Philippe Shubik showed that tumor transplants secrete a substance stimulating the growth of blood vessels (Greenblatt and Shubi 1968), later identified as “tumor angiogenic factor (TAF)” by Judah Folkman in 1971 (Folkman et al. 1971). Folkman also suggested that TAF can be a target of a therapy itself. This was a revolutionary idea, at the time, as it did not target the tumor cells directly acted on their environment.
During the 1970s, oncogenes and tumor suppressor genes were discovered. Oncogenes are genes that allow a cell to become a cancer cell, while the tumor suppressor genes would repair DNA or execute cell death of a damaged cell. A new dimension to cancer studies was added in the 1980s, epigenetic changes were proven to occur to both oncogenes and tumor suppressors (Feinberg and Vogelstein 1983; Greger et al. 1989), which are presently known as epigenetic markers used for diagnostics and therapeutic targets for cancer.
In 1982, Aline van Pel and Thierry Boon (Van Pel and Boon 1982) discovered that a specific immunity to spontaneous tumor cells could be induced by vaccinating mice with mutagenized tumor cells. This raised an inspiration for many years of immune therapy development.
In Napoleone Ferrara and colleagues identified the gene encoding vascular endothelial growth factor (VEGF) that was shown to stimulate the growth of endothelial cells proliferation in vitro and angiogenesis (blood vessels formation) in vivo (Leung et al. 1989).
In 1999 for the first time, gene-expression was used to study cancer (leukemia) by Todd Golub, Donna Slonim and colleagues (Golub et al. 1999).
Since the end of the 20th century, cancer screens are developed along with multiple strategies to fight the tumor. Most classical ones are based on the idea of removing tumor cells (surgery), killing tumor cells with DNA-blocking drugs (chemotherapy), radiation, inhibit cancer growth (hormonal therapy, adjuvant therapy and immunotherapy). As none of those methods is fully efficient, often a combination of treatments is proposed. Nowadays, science is aiming in the direction of targeted therapies and personalized treatment.
The recent success of immunotherapies (discussed in Immunotherapies section attracted the attention the scientific community again to the context in which tumor cells are found. This context called Tumor Microenvironment, as well as the communication that happens within it between different agents nowadays studied differently with available knowledge of molecular biology, have become a popular scientific topic of the 21st century (Fig. 1.2).
Figure 1.2: Percentage of publications containing the phrase “tumor immunotherapy” is growing, numbers retrieved on 17.01.2018 from Medline Trends (Corlan 2004)
1.1.2 Tumor Microenvironment as a complex system
Tumor Microenvironment is a complex tissue that surrounds tumor cells. It is composed of different compartments (in solid tumors):
- Stroma: blood and lymphatics vessels, epithelial cells, mesenchymal stem cells, fibroblasts, adipocytes supported by extracellular matrix (EM)
- Immune cells: T cells, B cells, NK cells, Dendritic cells, Macrophages, Monocytes etc.
Their proportion and specific roles vary significantly with tumor type and stage. Communication between the environmental cells and the tumor is critical for tumor development and has an impact on patient’s response to treatment. This communication between different compartments is bidirectional and all the players can influence each other. Depending on the nature and prevailing direction of those interactions different destiny is possible for each of the compartments, i.e. immune cells can be recruited to protect tumor cells or they can kill them directly. Many of the signals can be contradictory, many can suppress each other. Then is it possible to tilt this complex ecosystem into patients’ favor? Can we decipher the most important factors of this molecular knot and manipulate it?
Next section describes different scenarios of interaction within TME in order to illustrate the complexity of TME and possible targets for cancer therapies.
We recommend watching this video in order to visualize the TME and cancer thanks to 3D animations
1.1.2.1 Interactions between TME and Tumor
Three scenarios can be considered to describe the relationship between TME and tumor cells:
- TME stimulates tumor growth and/or progression and/or impact negatively the response to treatment
- TME has no influence on tumor cells and disease development
- TME has a tumor-suppressive role and impact positively the response to treatment
As it is presented in Section 1.1.1 these three hypotheses were gaining and losing popularity in the scientific and medical community over the decades.
1.1.2.1.1 TME as a foe: inflammation
In 1863 Rudolf Virchow observed a link between chronic inflammation and tumorigenesis. According to Virchov theory, the genetic damage would be the “match that lights the fire” of cancer, and the inflammation or cytokines produced by immune cells should be the “fuel that feeds the flames” (Balkwill and Mantovani 2001). Therefore lymphocyte infiltration was confirmed by subsequent studies as a hallmark o cancer. The question one may ask is why our immune system is not enough to defend the organism from tumor cells as it does efficiently in a range of bacterial and viral infections? It is mainly because of the ability of tumor cells to inhibit immune response through activation of negative regulatory pathways (so-called immune checkpoints).
It is worth mentioning, that the immune system can be already disabled and therefore cancer has more facility to develop. The immune system can be less efficient for example because of drugs given to patients after transplants of because of diseases like HIV/AIDS. These people have higher probability to develop cancers caused by infectious agents (viruses). These cancers are non-Hodgkin lymphoma (NHL) (caused by Epstein-Barr virus (EBV) infection), lung (no identified specific infectious agent), kidney (no identified specific infectious agent) and liver (caused by chronic infection with the hepatitis B (HBV) and hepatitis C (HCV) viruses) cancers. Human papillomavirus (HPV), can cause cervical, anal, oropharyngeal, and other cancers.
In the case of non-infectious cancers in patients with no history of immunosuppressive drugs intake or diseases, the question how tumor manages to break natural defence remains even more interesting. Many examples can be cited on how TME facilitates tumor development (Fig. 1.3). For instance, in the early stages of tumorigenesis, some macrophage phenotypes support tumor growth and mobility through TGF-beta signaling. Also, it was shown that NK cells and myeloid-derived suppressor cells (MDSCs) have an ability to suppress immune defence i.e. immunosurveillance by dendritic cells (DCs), T cell activation and macrophage polarisation and they promote tumor vascularization as well. (Talmadge and Gabrilovich 2013; Gabrilovich, Ostrand-Rosenberg, and Bronte 2012) They create so-called niches that facilitate tumor colonization. T-regs and myeloid-derived suppressor cells can negatively impact natural immune defense and by these means allow growth and invasion of tumor cells (Taube et al. 2017). Another cell type, a part of EM, fibroblast, or more precisely Cancer-Associated Fibroblasts (CAFs) have proven pro-tumor functions in breast cancer where they enhance metastasis (Dumont et al. 2013). The blood and lymphatic vessels maintain tumor growth providing necessary nutritive compound to malignant cells.
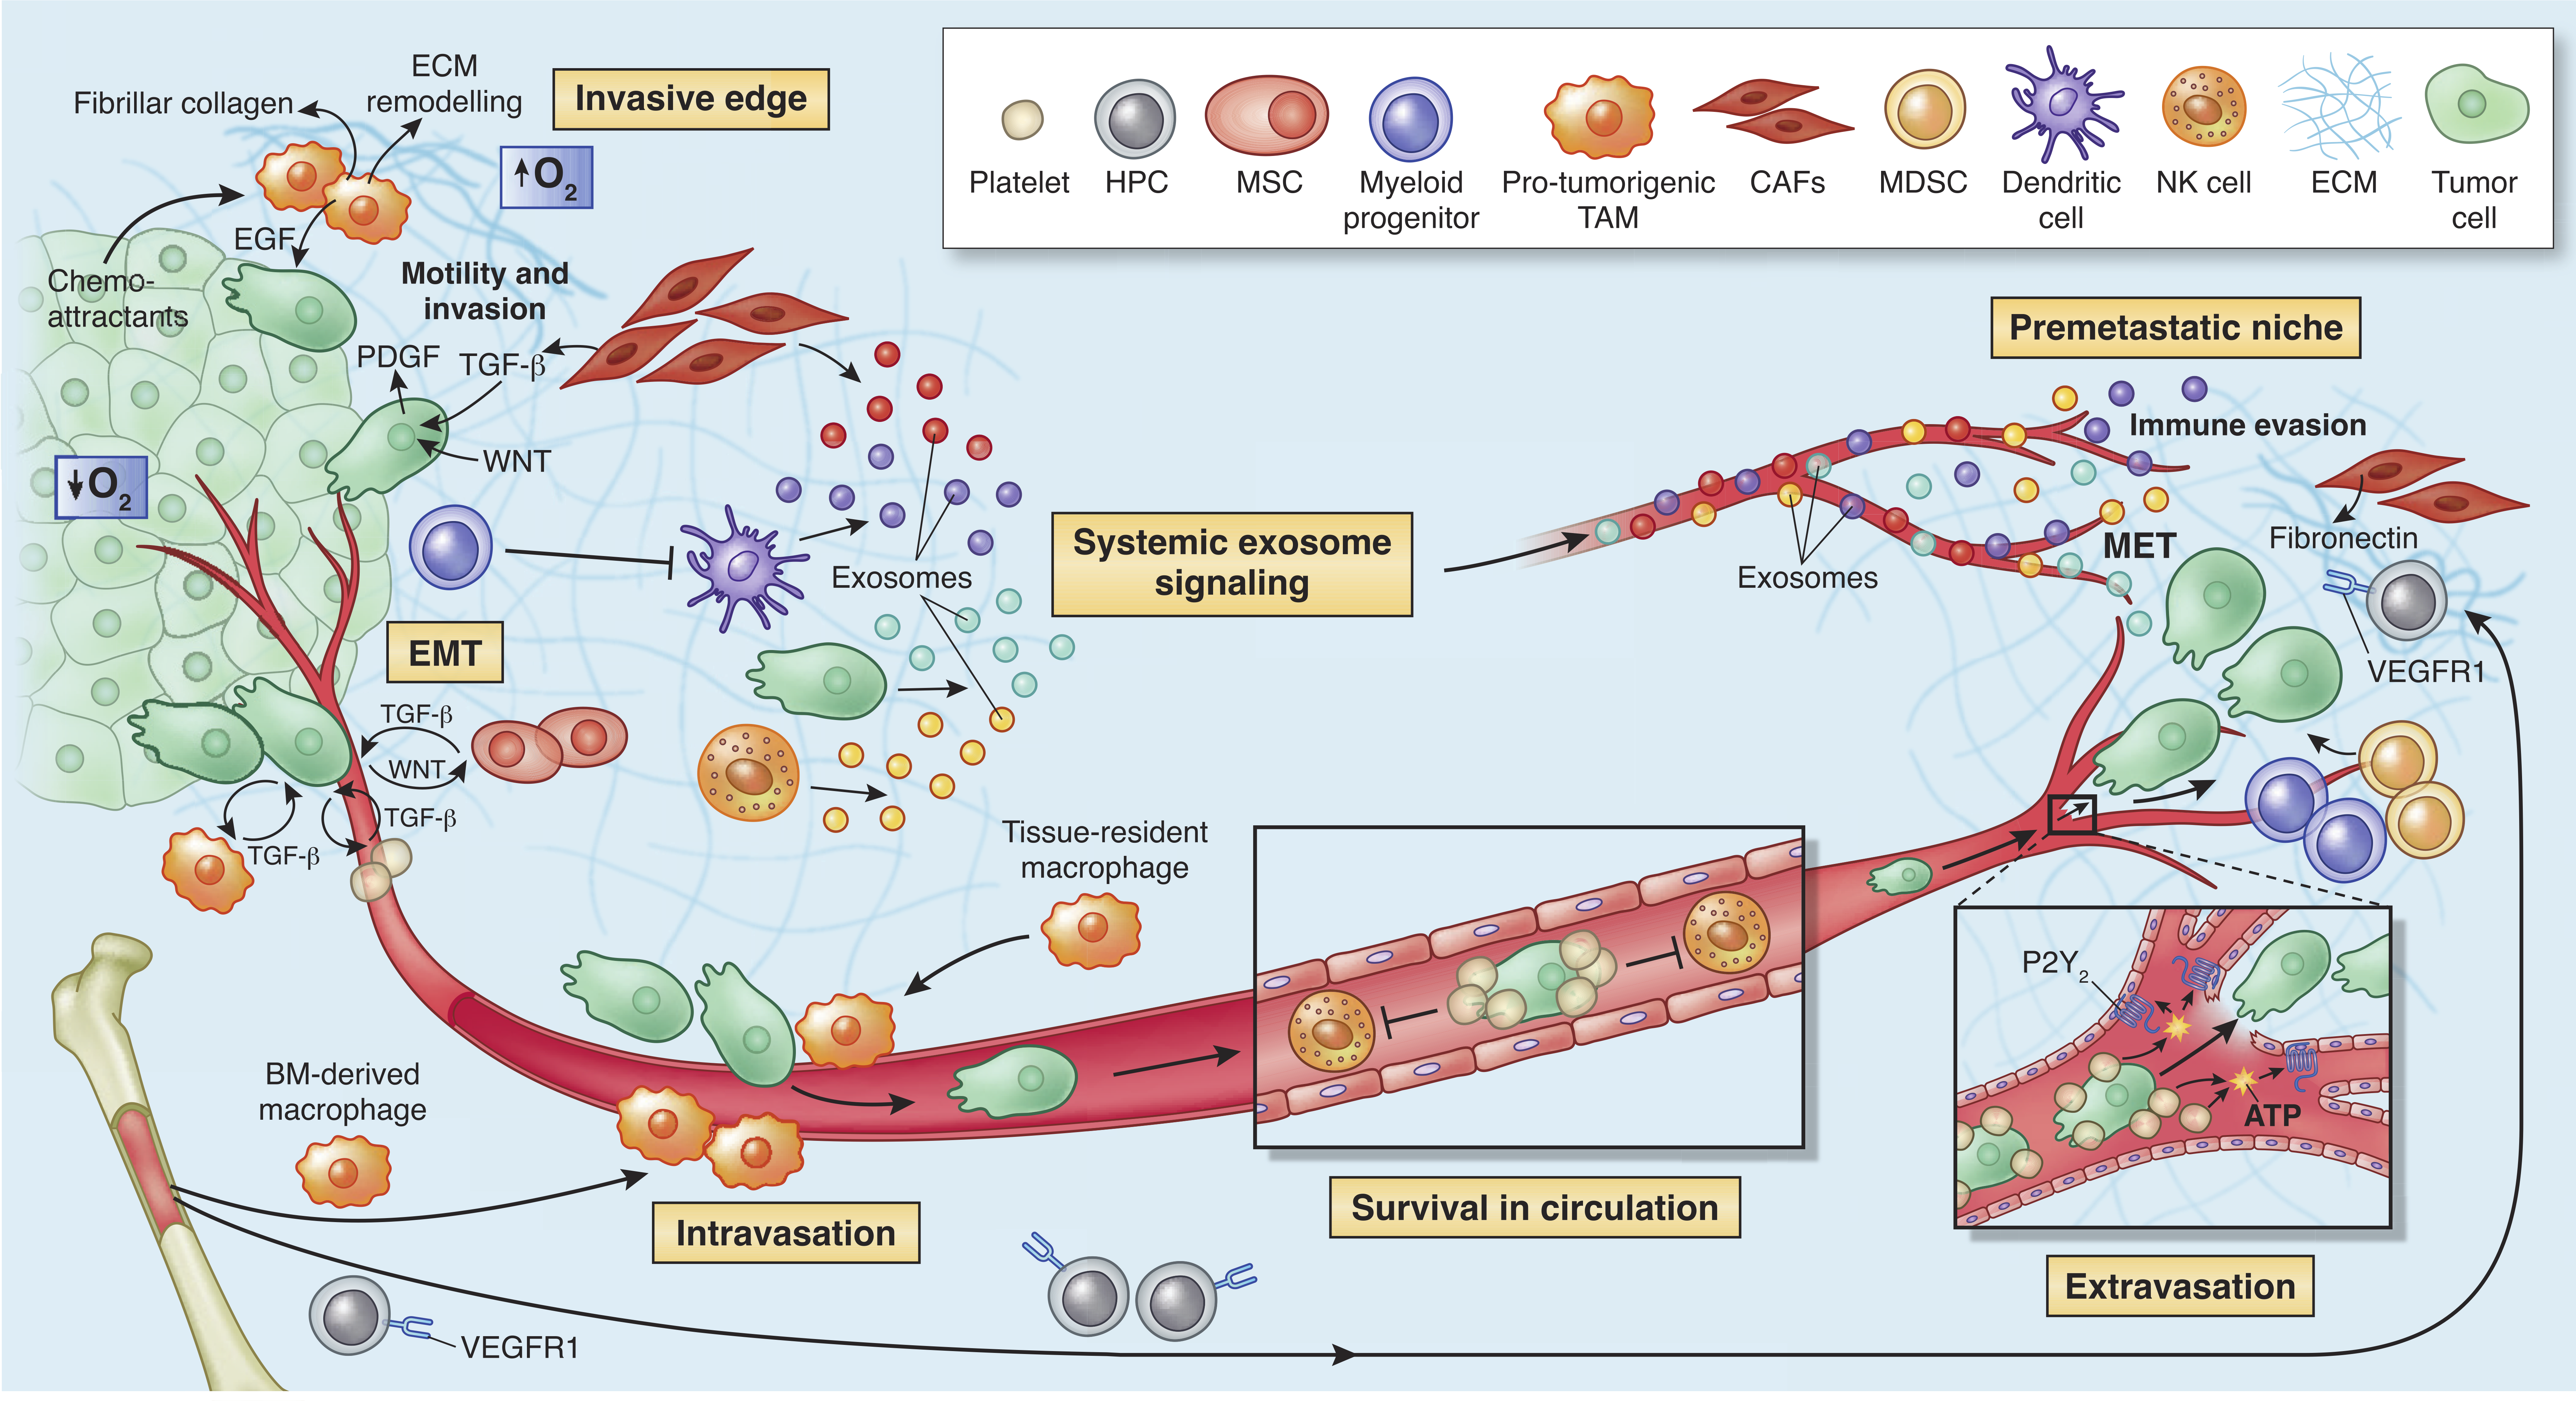
Figure 1.3: The microenvironment supports metastatic dissemination and colonization at secondary sites. Different tumor sites can communicate through exosomes realized by tumor cells and also immune and stromal cells such as NK cells, CAFs and DCs. Reprinted by permission from Springer Nature (Quail and Joyce 2013) © 2013 Nature America, Inc. All rights reserved.
According to (Hanahan and Coussens 2012) immune and stroma cells participate in almost all of Cancer Hallmarks (Hanahan and Weinberg 2000; Hanahan and Coussens 2012). Most of the hallmarks of cancer are enabled and sustained to varying degrees through contributions from repertoires of stromal cell types and distinctive subcell types.
1.1.2.1.2 TME seen as neutral
In front of lack of definitive proof that TME can positively or negatively impact on tumor development, many scientists, in a long time, ignored the importance of this factor. Until the early-mid eighties, the TME research was mostly limited to angiogenesis and immune environment and most areas that are now driving the field were not represented.
From the early 70s until the end of the 90s. the most accepted statement was that genetic alterations in oncogenes and tumor suppressor genes are both necessary and sufficient to initiate tumorigenesis and drive tumor progression. Therefore TME was not seen as an important element of the puzzle.
The cancer geneticists, at the time, had a lot of influence on scientific community diminishing the work made on TME which were considered as “uninteresting” and definitely not “mainstream”.
After the 90s, with the discovery of signaling molecules involved in the communication of TME like VEGF general opinion started to change. Furthermore, discoveries made by developmental biology field supported the hypothesis that microenvironment plays an important role in development which was later shown for tumorigenesis. Additionally, the success of immune vaccines starting with the tuberculosis vaccine Bacille Calmette-Guérin (BCG) in 1976 and finishing, at the moment with checkpoint inhibitors did not leave the scientific community indifferent.
1.1.2.1.3 TME as a friend: immunosurveillance
As mentioned in Section 1.1.1 Paget proposed a hypothesis of “seed and soil” where the TME in a certain tissue (the soil) can either stimulate or suppress the metastasis (the seed). William Coley tested a possibility to trigger tumor-suppressive effect via stimulation of the immune system with bacteria. In the 1960s, the immune surveillance theory hypothesized “the ability to identify and destroy nascent tumors as a central asset of the immune system” (Sebeok 1976; Burnet 1970). Thus, the hypothesis that TME can have a positive role in tumor prognosis is not new.
In modern immuno-oncology, the term immune-editing was introduced by Dunn et al. (2002) in 2002, to describe the relationship between the tumor cells and the immune system. The immunosurveillance through immune-editing can be summarized in three processes: elimination, equilibrium, and escape (Dunn et al. 2002).
The elimination is the direct killing of cancer cells or growth inhibition by the immune system. The adoptive T cells and NK are actively involved in tumor killing and stimulate other immune cells. The CD8 + cytotoxic lymphocytes (CTLs) directly recognize tumor cells. Employing perforin- and granzyme-dependent mechanisms they can lyse tumor cells. The CD4 + T cells release factors to induce proliferation of B cells and to promote their differentiation to the antibody (Ab)-secreting plasma cells, activate macrophages. Macrophages use phagocytosis to eliminate cancer cells (Vesely et al. 2011).
The tumor-infiltrating lymphocytes (TILs) have been associated with an overall good prognosis and better survival in different cancer studies. Moreover, abundance of CD3 + and CD8 + T cells, NK cells, and \(\gamma\delta\)T cells correlate with improved outcomes in epithelial ovarian cancers (Marquez-Medina, Salla-Fortuny, and Salud-Salvia 2012). Several studies report that the presence of the abundant immune infiltrates is correlated with a good prognosis or better survival (Kornstein, Brooks, and Elder 1983; Baxevanis et al. 1994; Naito et al. 1998; Pagès et al. 2005). Spontaneous regression of human tumors has been reported in cutaneous melanoma, retinoblastoma, osteosarcoma, etc. (Aris, Barrio, and Mordoh 2012).
The equilibrium is the phase when cancer and immune cells coexist and their crosstalk is preventing metastasis.
T cells are the main actor in maintaining the equilibrium. Progressively, the tumor cells become more immunogenic as they are not edited by the immune system (Bhatia and Kumar 2011). The state of tumor cells is then identified as “dormant” and active scientific reports investigate the possible molecular pathways that maintain dormancy or lead to escape (Teng et al. 2008).
The immune escape is the final process when tumor cells impair the immune response.
1.1.2.2 Two-faced nature of immune cells: context-dependent functional plasticity
A modern vision of TME-tumor interactions assumes that tumor can be directed to several molecular pathways. This direction is decided by signals that are native of tumor cell and/or coming from the microenvironment.
Recent studies unveil ambivalent nature of immune cells in TME. While some as cytotoxic T cells, B cells and macrophages can manage to eliminate tumor cells. Treg cells role is to regulate expansion and activation of T and B cells. Depending on cancer type, they can be either pro- or anti-tumor. For example, as it has been shown for T-regs, that are usually associated with bad prognosis, they can be equally associated with improved survival (i.e. in colorectal cancer (Frey et al. 2010)). For innate immunity, there are widely accepted M1 (anti-tumor) and M2 (pro-tumor) extreme macrophages phenotypes in TME (Qian and Pollard 2010). Most of the statements seem to be context dependent and not valid universally across all cancer types. We already mentioned Macrophages phenotypic plasticity as well as the different behavior of EMC depending on tumor stage.
From a more general point of view, it has been observed that immunodeficiency can correlate with high cancer incidence. Results of analysis based on observations of 25,914 female immunosuppressed organ transplant recipients, the tumor incidence was higher than predicted for multiple cancers. However, the number of breast cancer cases decreased which can be really disturbing if we need to decide on the role of immune defense in tumor progression (Stewart et al. 1995). This indicates that immune microenvironment can be cancer stimulating or inhibiting depending on the type of cancer and/or other factors.
1.1.2.3 Immune cell (sub)types in TME
We are taught that a cell is the basic structural, functional, and biological unit of all known living organisms. A human body contains around \(10^{14}\) which is three orders of magnitude more than the number of stars in the Milky Way. This ensemble of cells is traditionally classified into cell types based on their phenotypical variety.
for their immense number, the variety of cells is much smaller: only about 200 different cell types are represented in the collection of about \(10^{14}\) cells that make up our bodies. These cells have diverse capabilities and, superficially, have remarkably different shapes…. Boal (2002)
In the description of TME, I have referred to cell types of immune cells as well-established entities of the immune system. However, the definition of cell types remains controversial and there is no consensus among researchers on how exactly a cell type should be defined. The notion of the cell-subtypes is even vaguer. The problem does not only concerns immune cells, most of the cell types of our organism, classified initially according to their morphology, seem to fulfill multiple functions. One can also relate cell-type problem to species problem where scientist also debates about where to draw the borders between species. This problem is widely generalized as “theory of types” (Slater 2013) in many disciplines as philosophy, linguistics, mathematics.
In this chapter, I will limit the description to immune cell types.
An immune cell can be described nowadays along many axes:
- Phenotype /surface markers
- Morphology (expressed proteins)
- Ultrastructure (electron microscopy)
- Molecular data (gene expression, genotype, epigenome)
- Cell fate
- Cell of origin
- Function
Depending on how well a cell is different from all other cells along with those axes, it will (or not) be defined as a distinct cell type. Each of these axes contains a pièce of information that can agree with other axis or not. These features can be independent or can overlap depending on cell types in question. Historically, there were given different importance based on the technologies and general tendencies. Thus, there is no available general recipe applicable to discriminate all cell types from each other. Moreover, usually, it is not possible to measure all these axes simultaneously (because of the experimental, money or other constraints). Therefore, depending on the scientific question, different researches will give different weights to these axes and a combination of 2-3 most important features will be used to discriminate cell types in a given study.
Besides, the discrimination of the cell types comes with more or less subjective threshold on where the cells become significantly different. These thresholds can be established computationally or by an expert. The usual practice is a mix of both methods.
Since the beginning of immunology, there was disagreement between pre-defined cell types and cell functions.
Cette espèce de leucocytes a une grande ressemblance avec certains éléments fixes du tissu conjonctif, ainsi qu’avec des cellules endothéliales et des cellules de la pulpe splénique. On est donc souvent embarrassé, surtout lorsqu’on trouve ces leucocytes mononucléaires en dehors des vaisseaux, pour les distinguer des autres espèces de cellules mentionnées. — Elie Metchnikoff, Leçons sur la pathologie comparée de l’inflammation, 1891
The definition of cell types and subtypes is widely discussed today with the arrival of single cell technologies that allow a change of paradigm in cell classifications. Up to now, the top-down approach was mostly used. A pre-defined set of parameters describing a cell was fixed in order to select cells and then other parameters were measured. Now, it is possible to practice bottom-up approach where all (or some) parameters are measured for a single cell and then, depending on its distance from other cells, cell types are defined (Satija and Shalek 2014).
The concept of “cell type” is poorly defined and incredibly useful
— Allon Klein, Harvard Medical School
Researchers recognize that the concept of cell type is artificial and a continuum of cell types is closer to the reality. According to Susanne Rafelski,
A useful way to classify cells might thus be a multiscale and multi-parameter cell-type space that includes vectors for key intracellular organizational, dynamic, and functional features as well as tissue location, gene expression etc.
Some, as Allon Klein, propose to introduce a concept of cell states which would better describe a cell depending on its context and function. However, an emerging challenge would be to connect cell states with historical cell types. (Ediorial Cell Systems 2017) .
Another aspect of cells, that I am not approaching in this thesis, is time. Cells are shaped by their environment, intrinsic and extrinsic events and can change states, functions etc. Can one cell belong to different cell types depending on its trajectory? How to include the dynamic aspect of the cells into the classification?
Thus, most scientists agree that used convention of cell types is not ideal and it is more matter of convenience than biological reality. This leaves a room to study cells and challenge existing classification. Describing cell types or cell states in the tumor microenvironment is extremely interesting as still little is know about the diversity of cell infiltrated in solid tissues.
1.1.2.4 Summary
Cancer is a disease concerning milliards of people with a long history. Scientific community recognizes the role of the environment where the tumor cells find themselves as an important factor influencing tumor development, prognosis and response to treatment. TME is a complex environment that constantly interacts with tumor cells, where both tumor and TME influence and shape each other.
Over the years, many interactions are being discovered and cell types re-defined and described in their context. However, lots of mechanisms and interactions of TME remains unknown due to very heterogeneous nature of this microenvironment. This leaves room for a more extensive investigation of TME.
A therapeutic goal is target interactions that would be able to pivot the essential processes in tumorigenesis or tumor escape in order to put the cells “back on track” and facilitate anti-tumor therapies.
These goals can be met thanks to the improvement of investigation methods, data quality and abundance. I will discuss the most important data types used in this project to investigate the TME.
1.2 Quantifying and qualifying immune infiltration (data)
Nowadays, more and more biological data is produced. However, this proliferation of accessible resources is not proportional to generated insights and wisdom. In this thesis, I aim to generate Knowledge and Insights and we hope to generate some Wisdom (Fig. 1.4). In this section, we will introduce the foundation of our analysis: different data types that will be further discussed and explored in chapters that follow.
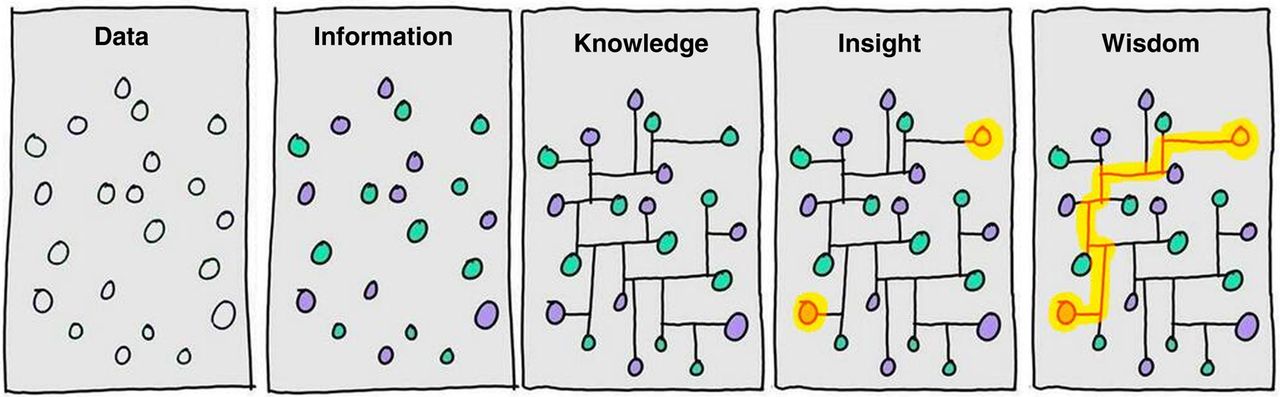
Figure 1.4: From Data to Wisdom. Illustration of different steps that it takes to go from Data to generating Wisdom. It highlights that generating data is not equal to understanding it and additional efforts are needed to generate value. Image authored by Clifford Stoll and Gary Schubert published by Portland Press Limited on behalf of the Biochemical Society and the Royal Society of Biology and distributed under the Creative Commons Attribution License 4.0 (CC-BY) in (Ponting 2017).
As discussed with the previous section cell-types, but also the whole systems can be described at different levels (along different axes). These different levels demand distinct technologies and strategies to be developed to enable the measurements. For instance, a phenotypic distinction between cells can be reached using FACS technology, for molecular profiles omic methods were developed and for ultrastructure microscopic methods. We need to approach biological systems from different angles as no one of these axis provide a complete picture of the studied system.
I will introduce most relevant data types that are used to study immune infiltration of tumors.
1.2.1 Cell sorting
1.2.1.1 Flow cytometry
Flow cytometry is a laser-based technology. It uses marker genes: cell surface proteins to sort cells in different compartments. Nowadays, it permits quantification of the abundance of up to 17 cell surface proteins using fluorescently labeled antibodies (Papalexi and Satija 2017). However this techniques is not free from bias, our knowledge about cell markers is limited and several markers may not be relevant in some context. Moreover, the scientific community did not clearly agree on the marker choice even for popular and well-studied cell types which introduced additional heterogeneity when independent studies are compared. Also, the quality of antibodies may influence the results of the FACs analysis. Besides those limitations FACs remains quite a popular method for analyzing cells in complex tissues. It was among first methods that allowed molecular phenotyping of immune cells, a discovery of numerous subsets and their further functional interpretation.
1.2.1.2 Mass cytometry
Mass cytometry (also known as CyTOF allows for the quantification of cellular protein levels by using isotopes. It allows to quantify up to 40 proteins per cell (Papalexi and Satija 2017). It also demands lower starting number of cells (1000 - 1000000), a realistic number that can be extracted from patient biopsy (Lyons et al. 2017).
1.2.2 Microscope Staining
Using microscope technics, histopathological cuts are analyzed. The number of cells per a unit of area (i.e. mm\(^2\)) is defined either manually by a human or through diverse image analysis algorithms.
Current pathology practice utilizes chromogenic immunohistochemistry (IHC) (NPR 2010a). Multiplexed approaches allow identifying multiple markers in the same histopathology cut. Modern techniques like imaging mass cytometry using FFPE tissue samples uses fluorescence and mass cytometry to identify and quantify marker proteins (Giesen et al. 2014).
The main advantage of aforementioned technics the number of cells that can be analyzed and the information about the spatial distribution of the different cell types. The limiting factor, as for cell sorting methods, is the number of markers (~10-100) and consequently a number of cell types that can be identified (Schelker et al. 2017).
The cell sorting methods and microscope staining are usually considered as a gold standard for multidimensional data techniques. The reason why they are not applied at large scale is the cost but also quite laborious and time-consuming sample preparation demanding a fresh sample. In contrast, the omics methods propose a more scalable way to measure tumor microenvironment.
1.2.2.1 Tissue Microarrays
Tissue Microarrays aim to automatize “staining” techniques. A large number of small tissue segments can be organized in a single paraffin block where 100 tissue samples can be easily examined on one slide. A variety of molecular or microscopic method can be then applied to FFPE tissue including immunohistochemistry, FISH, and in situ hybridization (Wilczynski 2009). It is a technique in between traditional imaging and omic high-throughput.
1.2.3 omics
In biological systems information is coded in the form of DNA that do not vary a lot between different individuals of the same species. To trigger a function in an organism, a part of the DNA is transcribed to RNA, depending on the intrinsic and extrinsic factors, and after additional modification messenger RNA (mRNA) is translated into a protein (i.e., digestive enzyme) that fulfill a role in the organism. The mRNA information (also called transcriptome) can be captured with experimental methods at high throughput (transcriptomics) and provides an approximation of the state of the studied system (i.e., a tissue). There is also information, not coded on the DNA sequence but in a pattern of chemical species that can regulate the state transition of DNA information. These additional regulators are called epigenome collectively and some of them, like methylation, can also be measured at high-throughput.
1.2.3.1 Transcriptome
Transcriptomics measures the number of counts of mRNA molecules using high-throughput techniques. mRNA is the part of the genetic information that should be translated into proteins. It reflects the activity of ongoing processes in a cell. In contrast to DNA, mRNA concentration can be highly variable (Velculescu et al. 1997). This variability can be either “intrinsic” that reflect the stochastic process of cell machinery or “extrinsic” reflecting impact of factors upstream to mRNA synthesis (Satija and Shalek 2014).
Transcriptome can be measured by microarrays or RNA-seq NGS technology. Microarrays remain cost-efficient and popular technique designed in 90. There exist two and one fluorescent color probes, both representing different challenges in experimental design for batch effect removal. RNA-seq, in contrast, uses sequenced RNA to quantify the expression. As not only selected genes (probes) are quantified, it can be used to study unknown parts of the genome. RNA-seq is also characterized by lower background noise than microarrays.
Bulk transcriptome data are quite accessible nowadays. They can be obtained from either flash-frozen or formalin-fixed, paraffin-embedded (FFPE) tissue samples, including both surgically resected material and core needle biopsies (Schelker et al. 2017).
The main flaw of transcriptomic data is that the reproducibility between different platforms is limited. As a result, direct comparison (direct merging, statistical difference tests) between two datasets produced by different platforms is not advised. There are 12 thousand genes that are matching between four sequencing platforms. Through gene names conversions much information is lost, and bias is introduced.
In bulk transcriptome samples of heterogeneous tissues, different cells cannot be distinguished (Fig. 1.6A).
Different strategies can be adapted to analyze bulk transcriptome.
Cieślik and Chinnaiyan (2017) describes five groups of most popular approaches that can be applied to study transcriptome (Fig. 1.5). Despite a diversity of bioinformatic and statistical tools, the most popular differential approaches, mainly differential gene expression (DGE) based on the difference between two experimental conditions.
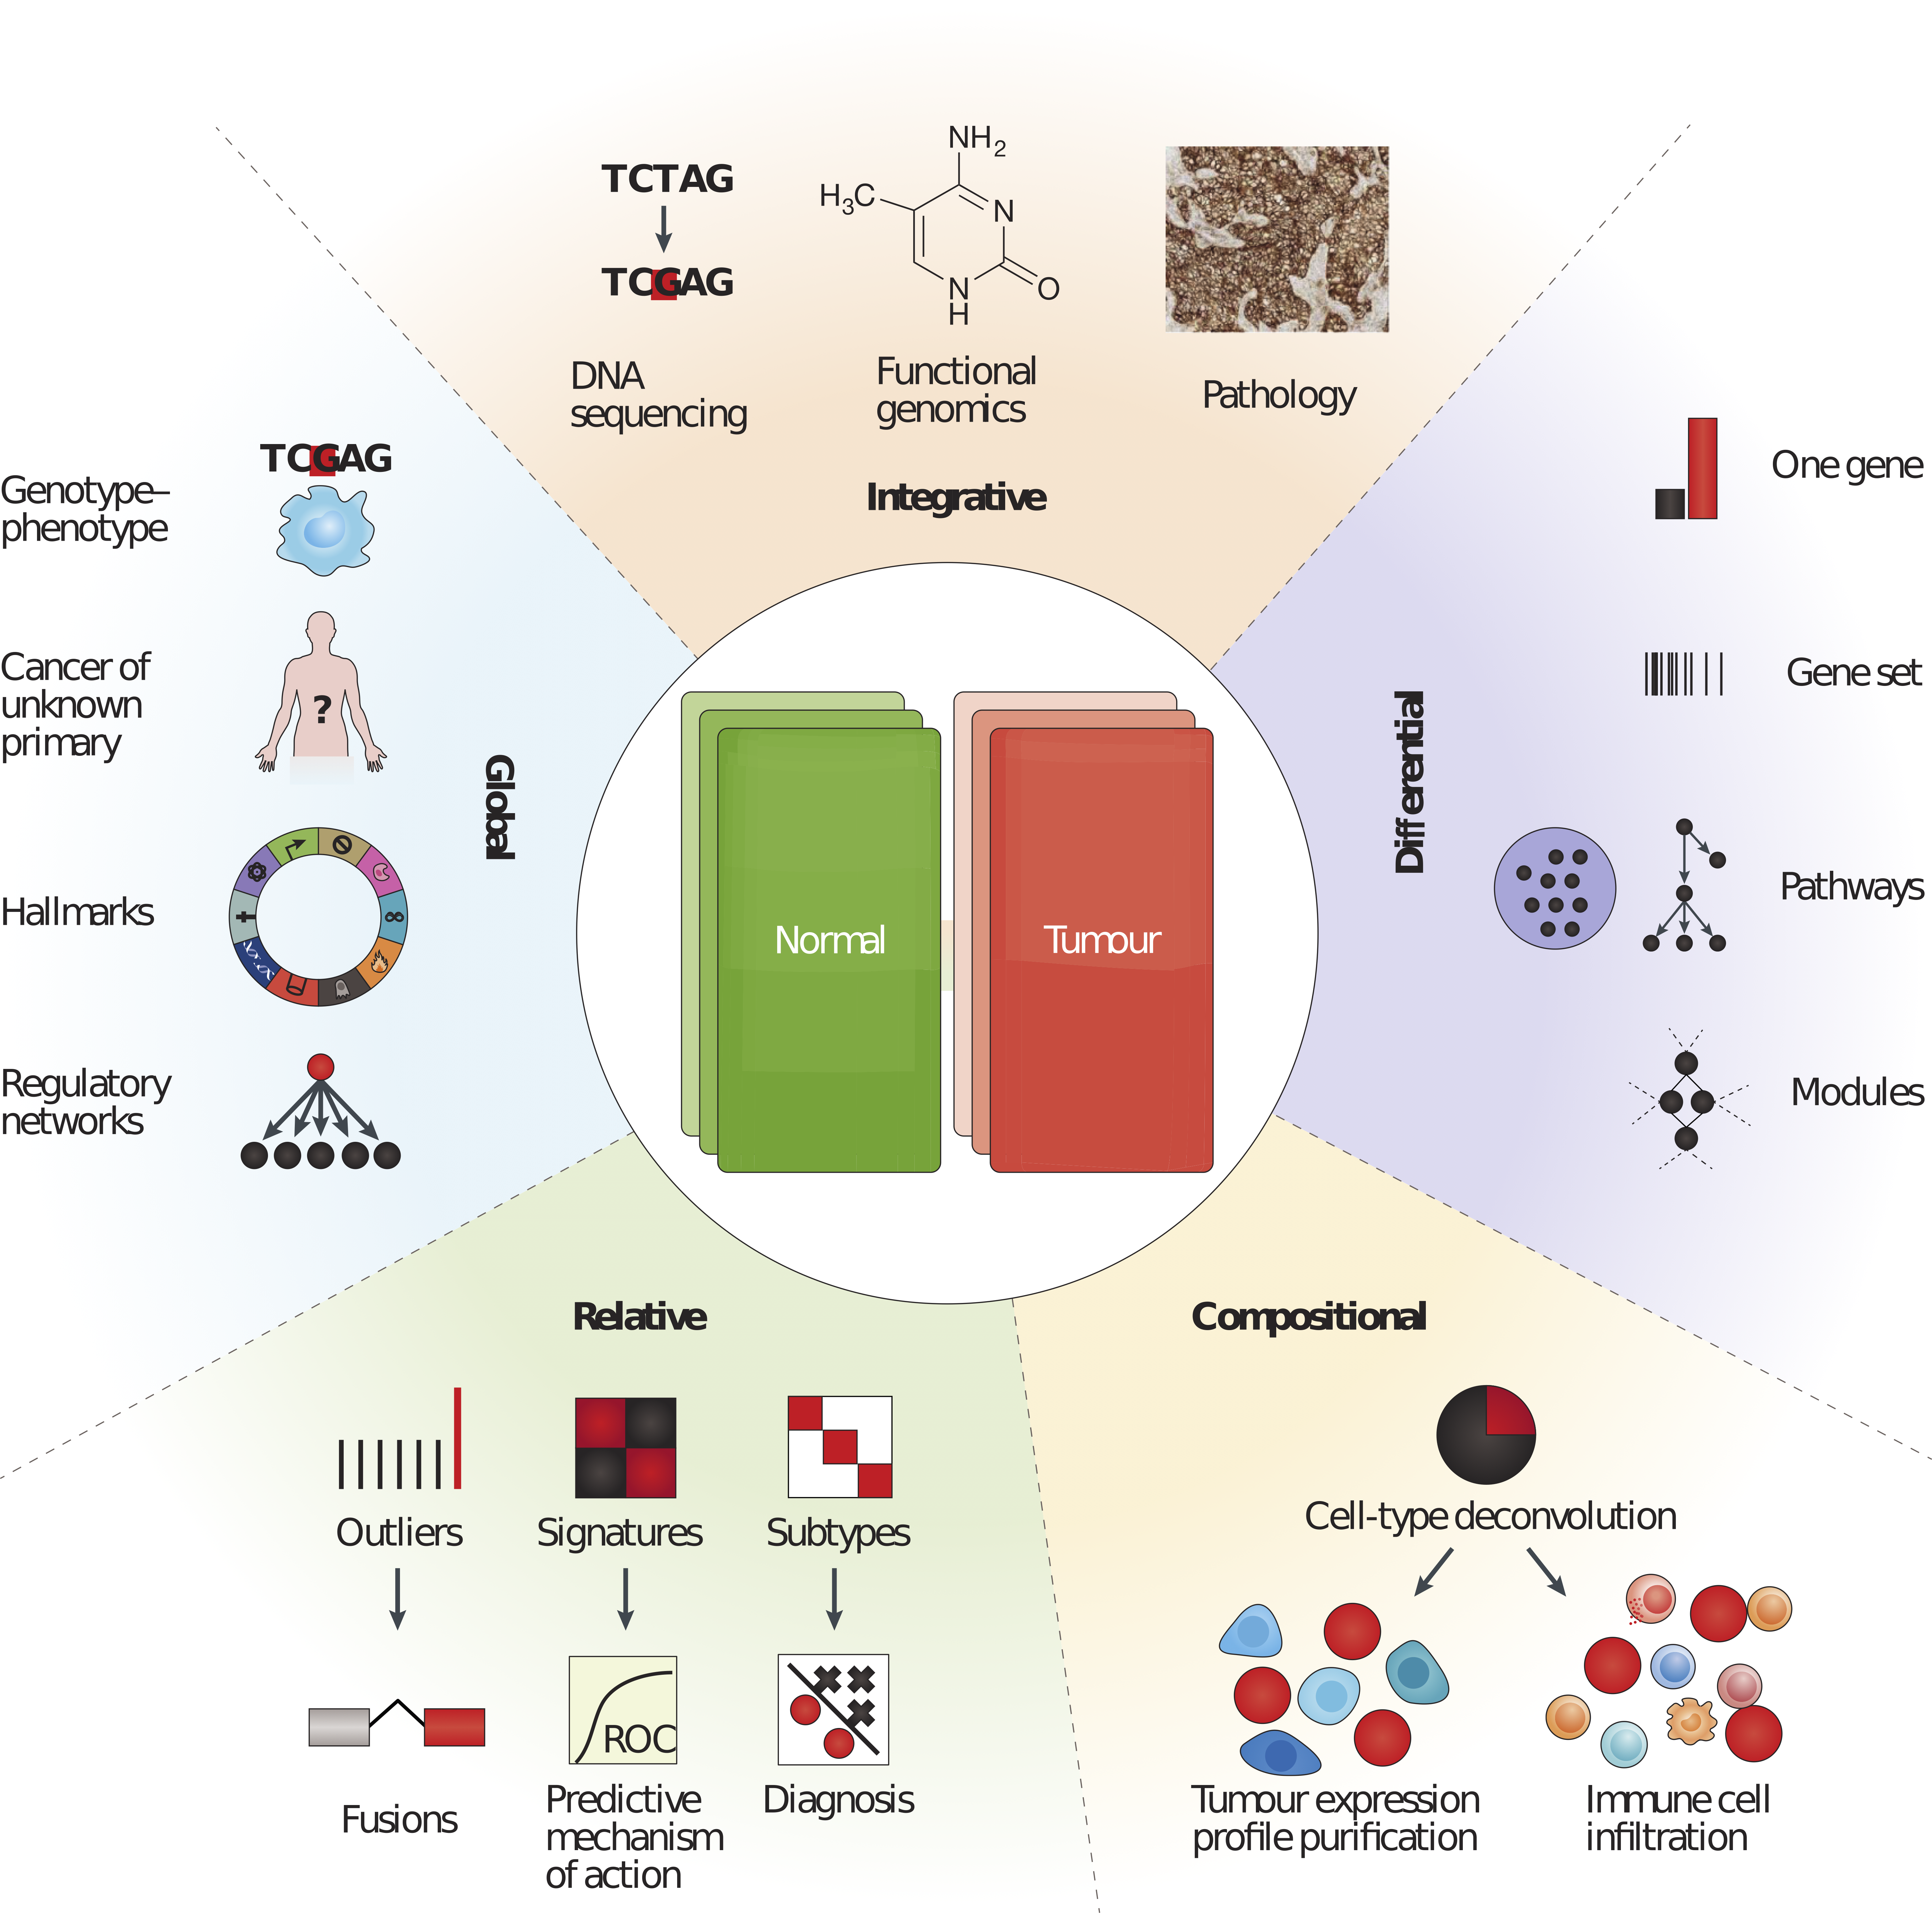
Figure 1.5: Five categories of RNA-seq data analysis. Differential analyses: comparing two (or more) conditions, Relative analyses: comparing to an internal reference (average, base level), Compositional analyses: inferring cell types or groups of cell types (i.e., tumor purity), Global analyses: pan-tissue and pan-cancer analyses and Integrative analyses: compiling heterogeneous data types. Reprinted by permission from Springer Nature (Cieślik and Chinnaiyan 2017) © 2018 Macmillian Publishers Limited, part of Springer Nature. All rights reserved.
Figure 1.6: Overview of approaches to identify cell types with different technologies: bulk transcriptome, scRNA-seq and spatial transcriptomics. A - Bulk analysis: cell types are mixed in a sample and can be found in the mixture thanks to known refrence cell type profiles, B - In single-cell analysis, tissues are first dissociated to a single-cell suspension and then profiled individually by single-cell RNA sequencing (scRNA-seq). Cell types, including previously unknown cell types, can be identified but no positional information is retained. C - In spatial analysis, sections are cut from tissue blocks and the position of cell types within the tissue can be identified using marker genes. This technique generates two-dimensional (2D) information but often for only a few genes. Once spatial data are available, scRNA-seq data can be mapped back onto the tissue and it is possible to reconstruct a 2D image of the tissue. Reprinted by permission from Annu. Rev. Biomed. Data Sci. (Chen, Teichmann, and Meyer 2018) © Copyright 2018. All rights reserved.
RNA-seq data was proven to be a useful indicator for clinical applications (Mody et al. 2015; Oberg et al. 2016; Robinson et al. 2017). Its utility for immune profiling was demonstrated in many studies through the use of transcriptomic signatures to predict immunotherapy response or survival (Chen et al. 2016).
In this work transcriptome data analysis falls into multiple categories: Compositional, Relative and aims to construct Global-level conclusions.
1.2.3.2 Single cell RNA-seq
Described above methods of process DNA from hundreds of thousands of cells simultaneously and report averaged gene expression of all cells. In contrast, scRNA-seq technology allows getting results for each cell individually. This is tremendous step forward enhancement of our understanding of cell heterogeneity and opens new avenues of research questions.
Continuous discovery of new immune subtypes has proven that cell surface markers that are used for phenotyping by techniques like FACS and immunohistochemistry cannot capture the full complexity. ScRNA-seq methods allow clustering known cell types in subpopulations based on their genetic features (Fig. 1.6B). ScRNA-seq is also able to capture particularly rare cell types as it requires much less of RNA material (1 ng isolated from 100-1000 cells) compared to ‘bulk’ RNA-seq ( ~ 1 μg of total mRNA transcripts ). It also allows studying cells at high resolution capturing the phenotypes in much more refined scale than previously (Papalexi and Satija 2017).
This new data type also brings into the field new challenges related to data processing due to the volume, distribution, noise, and biases. Experts highlight as the most “batch effect”, “noise” and “dropout effect” (Perkel 2017). So far, there are no official standards that can be applied which makes data comparison and post-processing even more challenging. Up to date, there are around 70 reported tools and resources for single cell data processing (Davis 2016). A limited number of single-cell datasets of tumors are made publicly available, and more are to come.
One can ask why then developing computational deconvolution of bulk transcriptome if we can learn relevant information from single-cell data. Firstly, that single cell data do not provide a straightforward answer to the estimation of cell proportions. The coverage is not full and sequenced single cells are not entirely representative of the actual population. For instance, neutrophils are not found in scRNA-seq data because of they are “difficult to isolate, highly labile ex vivo and therefore difficult to preserve with current single-cell methods” (Schelker et al. 2017). Besides, a number of patients included in published studies of range <100 cannot be compared to thousand people cohorts sequenced with bulk transcriptome methods. This is mostly because single cell experiments are challenging to perform, especially in a clinical setting as fresh samples are needed (Schelker et al. 2017). Today, single cell technology brings very interesting “zoom in” perspective, but it would be incautious to make fundings from a restricted group of individuals universal to the whole population. Primary brake to the use of single cell technology more broadly might be as well the price that is nearly 10x higher for single cell sample compared to bulk (Core 2016).
In this work, we are using single cell data in two ways. Firstly, in Chapter 5 we compare immune cell profiles defined by scRNA-seq, blood and blind deconvolution (problem introduced in Immune signatures section). Secondly, in Chapter 6 we use single call data of Metastatic melanoma generated by Tirosh et al. (2016) to demonstrate heterogeneity of subpopulations of Macrophages and NK cells.
1.2.3.3 Epigenome
An epigenome can be defined as a record of the chemical changes to the DNA and histone proteins of an organism. Changes to the epigenome can provoke changes to the structure of chromatin and changes to the function of the genome (Bernstein, Meissner, and Lander 2007). Epigenome data usually contains information about methylation CpG island changes. In cancer, global genomic hypomethylation, CpG island promoter hypermethylation of tumor suppressor genes, an altered histone code for critical genes, a global loss of monoacetylated and trimethylated histone H4 were observed. Methylome profiles can also be used as a molecular signature of disease and potential diagnostic or predictive biomarker (Jeschke et al. 2017).
1.2.3.4 Copy number variation (CNV) and Copy number aberration (CNA)
The differences between human genome come in the majority from Copy Number Variation (McCarroll and Altshuler 2007). CNV regions constitute 4.8–9.7% of the whole human genome (Zarrei et al. 2015). They can be reflected in structural variation that is duplication or deletion of DNA bases. CNV can affect a lot of base pairs of DNA code (deletion of more than 100 genes) and result in a phenotype change.
In addition, there can be distinguished, Copy number alterations/aberrations (CNAs) that are changes in copy number that have arisen in somatic tissue (for example, just in a tumor), in contrast to CNV that originated from changes in copy number in germline cells (and are thus in all cells of the organism) (McCarroll and Altshuler 2007). CNV and CNA profiles can be associated with diseases or cancer subtypes.
There exist disease-related exome panels that focus on regions with high copy variation, or the full exome can be sequenced using whole-exome sequencing (WES) (Yamamoto et al. 2016).
1.2.3.5 Spatial transcriptomics
Spatial transcriptomics provides quantitative gene expression data and visualization of the distribution of mRNAs within tissue sections and enables novel types of bioinformatics analyses, valuable in research and diagnostics (Ståhl et al. 2016)
It combines RNA-seq technology with spatial labeling which allows having a bulk gene expression of 10-20 cells with given space coordinates within the sample (Fig. 1.6). It allows to localize regions of highest gene expression and perform Spatially Variable Genes (Svensson, Teichmann, and Stegle (2018)). Some attempts were already made to combine Spatial Transcriptomics and scRNA-seq (Moncada et al. 2018). It remains an early-stage technique, and so far it is not widely used, but it might be a future of omics to add spatial information as it can be essential for many research problems.
1.3 From cancer phenotyping to immune therapies
This section outlines different methods of cancer immune phenotyping and progress in cancer therapies with a focus on immune therapies. It will link the ongoing research on TME with therapeutical potential.
1.3.1 Cancer immune phenotypes
Since 20s century physicians decided on common nomenclature that classifies tumors into distinct groups that are relatively homogenous or that share common characteristic important for treatment and prognosis. Tumor typing should help to predict prognosis better, to adopt a therapy to the clinical situation, to enable therapeutic studies which are essential in proving any therapeutic progress.
Most of the classifications are based on clinical data. Most common factors taken into account are the degree of local invasion, the degree of remote invasion, histological types of cancer with specific grading for each type of cancer, possibly various tumor markers, general status of the patient.
However, cancers with similar morphological and histopathological features reveal very distinct patterns of progression and response to therapy (Galon et al. 2014). In the era of gene sequencing, gene and protein expression, as well as epigenome, can provide valuable complementary information. Therefore gene markers or proteomic abnormalities can be integrated into classification panel. One famous example is a gene signature PAM50 (Parker et al. 2009) used for prediction of patients’ prognosis in breast cancer, patented as a tumor profiling test.
Since the increase of importance of the immunotherapies, researches proposed several ways to classify tumors based on their microenvironment. Given different parameters describing TME, cancers can be sorted into groups that show similar characteristics. We will discuss most common frameworks that allow for phenotype cancers based on the TME.
The localization of the immune cells can be an indicator of the state and response to the therapy (Bindea et al. 2013).
The most standard approach is to convey an analysis of histopathological cuts to asses the number of infiltrating lymphocytes (TILs). Two typical patterns are usually identified: “hot” - immune inflamed and “cold” - no active immune response (Berghoff, Kather, and Jäger 2018).
Chen and Mellman (2017) describe classification into inflamed and non-inflamed tumors, where non-inflamed phenotypes: can be further split into the immune-desert phenotype and the immune-excluded phenotype (Fig. 1.7). The inflamed phenotype is characterized by the abundant presence of immune cells: T cells, myeloid cells, monocytes in tumor margin. Along with the immune cells, due to their communication, a high expression of cytokines is characteristic for this phenotype. According to Chen and Mellman (2017), this is a mark that an anti-tumor response was arrested by the tumor. The inflamed phenotype has shown to be most responsive to immunotherapies. In the immune-excluded phenotype, the immune cells are present as well but located in the stroma (Herbst et al. 2014), sometimes penetrating inside the tumor. However, when exposed to checkpoint immunotherapy, T cells do not gain the ability to infiltrate the tumor; therefore the treatment is inefficient. The immune-desert main features are little or no presence of immune cells, especially T cells. Surprisingly, these tumors have been proven to respond rarely to the checkpoint therapy (Herbst et al. 2014). In non-inflamed tumors, cytokines associated with immune suppression or tolerance are expressed.
Figure 1.7: Cancer-immune phenotypes: the immune-desert phenotype (brown), the immune-excluded phenotype (blue) and the inflamed phenotype (red). The immune-desert phenotype is characterized by a paucity of immune cells and cytokines. In the immune-excluded phenotypes, the T cells are often present but trapped in the stroma, enabled to migrate to the tumor site. The immune-inflamed phenotype is rich in immune cells and the most responsive to the immune checkpoint therapies. Reprinted by permission from Springer Nature (Chen and Mellman 2017) © 2017 Macmillian Publishers Limited, part of Springer Nature. All rights reserved.
A presence of immune phenotypes was confirmed by for example by Becht et al. (2016) in colorectal cancer, where after deconvolution of bulk tumor profiles, patterns of immune and stromal cells abundance was matching four cancer subtypes. The good prognosis was related to cytotoxic response and bad prognosis to lymphocytes and cells of monocytic origin.
According to Gajewski et al. (2006), the immunogenicity of the tumors can be explained by tumor-intrinsic factors and tumor-extrinsic factors. Tumor-intrinsic factors are the neoantigen load and frequency, the mutational load, the expression of immunoinhibitors and immunostimulators (e.i. PD-L1), and alteration of HLA class I molecules. Tumor-extrinsic factors include chemokines regulating T cell trafficking, infiltration of effector TILs and immunosuppressive TILs, and soluble immunomodulatory factors (cytokines).
1.3.2 Scoring the immune infiltration
Experimental techniques and computational tools enabled us to characterize and classify TME with multi-omics data. Here I present a short list of most recent and influencial analysis aiming to redefine tumor phenotypes based on the immune infiltration, with a focus on computational techniques.
1.3.2.1 Immunoscore
Jerôme Galon lab in Paris authors one of the most recognized scoring method, based on fluorescent images and names Immunoscore. The Immunoscore ranges from 0 to 4 and it is based on the density of lymphocyte populations CD3/CD45RO, CD3/CD8, or CD8/ CD45RO. It also takes into account the spacial position of the cells: the tumor core and margins (Galon et al. 2012). It was successfully applied to colorectal cancer to predict patients’ survival (Anitei et al. 2014). Since then, it resulted in numerous application to many cancer types. Immunoscore has been recently validated in a large cohort international independent study (14 centers in 13 countries) as a relevant prognostic score of time to recurrence, defined as the time from surgery to disease recurrence (Pagès et al. 2018).
The immunoscore is an interesting indicator, especially in the scope of clinical applications, although it does not tell us a lot about underlying biology. It is also limited to a few cell types while it may be that in some cancer types or patients, the system requires more detailed or rich analysis of a larger panel of cells.
1.3.2.2 Spatiotemporal dynamics of Intratumoral Immune Cells of Colorectal Cancer
Bindea et al. (2013) published a quite complete, and supported with strong experimental evidence, immune landscape of colorectal cancer. Authors introduced the immunome compendium containing 577 cell-type-specific genes, derived from analysis of a significant corpus of publicly available data. They used it to analyze CRC large transcriptomic data (105 patients). Using qPCR (more sensitive technique than microarray) expression of 81 “representative” genes from the compendium was investigated in 153 CRC patients. This study validated correlation of markers of the same type and also revealed the correlation of different cell-type markers (i.e., T-cells and NK or Th and macrophages). The data matrix was grouped into 3 clusters which were corresponding to 1) tumor 2) adaptive 3) innate immune responses. Besides, spatial positioning of markers was visualized thanks to Tissue Microarray technology in samples from 107 CRC patients distinguishing marker densities in tumor center and tumor margin areas. This was followed by an in-depth study of chemokines expression and genomic alterations. Also, authors validated potential prognostic biomarkers in murine orthotopic CRC models.
In summary, using marker genes measured and visualized with different data types of CRC, a high inter-patient heterogeneity was observed. Adaptive immunity cells were associated with the core of the tumor and the innate ones with the tumor margin. A mechanism involving CXCL13, Tfh cells, B cells and IL-21 was identified as associated with good prognosis.
Authors suggest a dynamic dimension of the study which is in practice comparison between tumor stages. It can be argued that used time scale is too discrete and true dynamics cannot be reflected only along tumor stages in different patients. It is extremely challenging to access truly dynamic data for human tumor biopsies, but some efforts are made in the direction of inclusion of sequential biopsies (“Sequential liquid biopsies reveal dynamic alterations of EGFR driver mutations and indicate EGFR amplification as a new mechanism of resistance to osimertinib in NSCLC.” 2017) that allow better time resolution. In brief, the field is still waiting for the landscape of TME truly dynamic in space and time.
1.3.2.3 Immunophenoscore
Different approaches, sub-typing oriented, are based principally on gene expression patterns. Most commonly, machine learning supervised algorithms are trained to match known phenotype (established with microscopy or with clinical features) to genetic patterns, or an unsupervised clustering is used to discover new classification.
An example of well-formulated classification framework is Immunophenoscore (Charoentong et al. 2017), based on the publication of Angelova et al. (2015), where methylome, transcriptome and mutation of TCGA CRC dataset (n = 598) was used to describe immunophenotypes. Later on, it was reduced to gene expression indicator and summarised in the form of a score. This scoring scheme is based on the data of 20 solid tumors, using the expression of marker genes selected by a machine learning algorithm (random forest) for best prediction in each cancer. These indicators can be grouped into four categories:
- MHC molecules (MHC)
- Immunomodulators (CP)
- Effector cells (EC)
- Suppressor cells (SC)
The immunophenscore (IPS) is calculated on a 0-10 scale based on the expression of genes in each category. Stimulatory factors (cell types) impact the score positively and inhibitory factors (cell types) negatively. Z-scores \(\geq\) three were designated as IPS10 and z-scores \(\leq\) 0 are designated as IPS0. A similar conceptual framework called cancer immunogram was proposed by Blank et al. (2016) included seven parameters: tumor foreignness (Mutational load), general immune status (Lymphocyte count), immune cell infiltration (Intratumoral T cells), absence of checkpoints (PD-L1), absence of soluble inhibitors (IL–6, CRP), absence of inhibitory tumor metabolism (LDH, glucose utilisation), tumor sensitivity to immune effectors (MHC expression, IFN-\(\gamma\) sensitivity). Charoentong et al. (2017) claim that the immunophenoscore can predict response to CTLA-4 and anti-PD-1.
Nonetheless, the details of the use of cancer immunogram in practice remain unclear and the result could be sensitive to patients’ and data heterogeneity as no standardization was proposed. It should also be validated in a systematic, independent study.
1.3.2.4 The immune landscape of cancer
| Cluster | Features | Macrophage..lymphocyte | Th1.Th2 | Proliferation | Intratumoral.heterogeneity | Other |
|---|---|---|---|---|---|---|
| C1 | Wound healing | Balanced | Low | High | High | |
| C2 | IFN-γ dominant | Lowest | Lowest | High | Highest | Highest M1 and CD8 T cells |
| C3 | Inflammatory | Balanced | High | Low | Lowest | Highest Th17 |
| C4 | Lymphocyte depleted | High | Minimal Th | Moderate | Moderate | |
| C5 | Immunologically quiet | Highest | Minimal Th | Low | Low | Highest M2 |
| C6 | TGF-β dominant | High | Balanced | Moderate | Moderate | Highest TGF-β signature |
Thorsson et al. (2018) performed a multi-omic analysis of TCGA datasets that allowed them to define six subtypes that are valid across cancer types (see Tab. 1.1 ).
Authors selected eight indicators to define these six phenotypes:
- differences in macrophage or lymphocyte signatures
- Th1:Th2 cell ratio
- extent of intratumoral heterogeneity
- aneuploidy
- extent of neoantigen load
- overall cell proliferation
- expression of immunomodulatory genes
- prognosis
These indicators were selected among many other indicators though machine learning (elastic net regression) for the best predictive power of survival.
All the data and computed parameters can be accessed at CRI iAtlas Portal. Among the six phenotypes C3 (Inflammatory) has the best-associated prognosis while C1 (wound healing) and C2 (IFN-\(\gamma\) dominant), much less favorable outcome. This again illustrates the ambivalent nature of the immune system as the best, and the worst prognosis is associated with immunologically active tumors. C4 (lymphocyte depleted) and C6 (TGF-\(\beta\) dominant) subtypes had the worst prognosis. The content of immune cells was determined using different tools and data types (expression, DNA methylation, images, etc.) We can learn a lot from the study. However, it seems difficult to integrate the methods into an ordinary practice because different data levels are necessary for the same samples to compute all the indicators.
1.3.2.5 A pan-cancer landscape of immune-cancer interactions in solid tumors
A different classification was proposed by Tamborero et al. (2018), also using TCGA data. They distinguished 17 immune infiltration patterns based on the immune cell proportions and 6 different clusters based on cytotoxicity measure across all cancer types (named immune-phenotypes) that were finally summarized in three groups: cytotoxic immune infiltrate, infiltrate with more immune-suppressive component and poor immune infiltrate. According to the analysis, one of the most critical factors is cytotoxicity. Tumors with high cytotoxicity were characterized by low clonal heterogeneity, with gene alterations regulating epigenetic, antigen presentation and cell-cell communication. The medium-level cytotoxic tumors had activated invasion and remodeling of adjacent tissue, probably favorable to immune-suppressive cells. The low cytotoxicity subgroup of tumors had altered: cell-cycle, hedgehog, \(\beta\)- catenin and TGF-\(\beta\) pathways. This result roughly overlaps with the one of Thorsson et al. (2018). The survival analysis based on the six immune-phenotypes revealed that for most cancer types, high cytotoxic tumors are associated with better survival. To evaluate tumor environment cells, authors used gene set variation analysis (Hänzelmann, Castelo, and Guinney 2013) with a set of pre-defined cell-type markers. Another important conclusion of Tamborero et al. (2018) is that tissue of origin is not the only important factor shaping cell-type patterns in tumors. However, the least infiltrated tumors were lung, uterine and bladder cancers, while the most infiltrated were pancreatic, kidney, skin cancers and glioblastoma. They also analyzed cancer cell pathways after computational purification of tumor samples (subtraction of the immune signal) to better understand cancer signaling.
A different approach is to characterize tumors based on signaling pathways organized in functional modules.
1.3.2.6 Immune maps
Another way to summarize tumor phenotype can be through the use of molecular maps. Atlas of Cancer Signaling Network (ACSN) (Kuperstein et al. 2013; Kuperstein et al. 2015) is a pathway database that contains a collection of interconnected cancer-related signaling network maps. An additional feature is ACSN web-based Google-maps-like visualization of the database. User data can be projected on the molecular map (for example gene/protein expression from user data can be paired with entities on the map ). ACSN 2.0 contains Cancer cell map and TME map (at the time: angiogenesis, innate immune map, T-cell signaling maps). All separate maps are available in Navicell website. Through projection of the data on the innate immunity map, one can see if a tumor sample is characterized by pro- or anti-tumor activated pathways due to the organization of the map layout. Also, different CAF subtypes were characterized by the CAF specific map in (Costa et al. 2018). Kondratova and colleagues (including myself) used the innate immune map to characterize NK and Macrophages subtypes (see Chapter Z).
1.3.2.7 Summary
Despite all scientific efforts, the gene expression-based classifications are not yet used in clinics. The measured multi-panel mRNA expression, which can be included into the category of In Vitro Diagnostic Multivariate Index Assay (IVDMIA) (Győrffy et al. 2015; Ross et al. 2008), may be a future of TME-based cancer classification, diagnosis and treatment recommendation (Gnjatic et al. 2017). For this best tools need to be used to evaluate the state of TME and tumor-stroma-immune cells communication properly.
1.3.3 Immune signatures - biological perspective
A gene signature is
a single or combined group of genes in with a uniquely characteristic pattern of gene expression that occurs as a result of an altered or unaltered biological process or pathogenic medical condition (Itadani, Mizuarai, and Kotani 2008; Liu et al. 2008).
They can be classified based on their form:
- metagene
- gene list
- weighted gene list
A term metagene or eigen gene describes an aggregated pattern of gene expression. The aggregation can correspond to simple mean of samples or can be obtained though matrix factorisation or source separation techniques, clustering. A metagene usually provides values for all measured genes (all probes) in contrast to a wighted gene list where weights are associated with selected genes.
Gene lists are simple enumeration of transcripts names or gene identifiers. Application of gene list is often limited to gene enrichment analysis tools or gene selection from the data.
An alternative is a weighted gene list or ranked gene list, where genes are ranked according to their importance. Often the ranks is obtained though comparison between two conditions or test/control. They can be also based on absolute gene expression values(Lyons et al. 2017). One possible problem with this weighted gene list can be platform dependence.
There exist a big choice of databases storing collections of signatures. They contain gene expression and other genomic data such as genotype, DNA methylation, and protein expression data attributed to some condition of reference. A big collection of immune signatures are regrouped by Immunological Genome Project (IGP, ImmGen) (Heng et al. 2008). Gene expression of protein coding genes measure in mice immune cells, ex vivo, in different conditions (drug treatment, perturbations) were regrouped in this ressource. A different ressource Immuno-navigator (Vandenbon et al. 2016) that stores information about human and murine immune genes and co-expression networks. ImmuneSigDB is a collection of gene-sets that describe immunity and inflammation in transcriptomic data (Godec et al. 2016) and a part of popular MSigDB ressource used commonly for gene set enrichment analysis (GSEA) (Subramanian et al. 2005).
They can also be classified based on their use:
- prognostic signatures
- predictive signatures
- diagnostic signatures
- specific signatures
The prognostic signatures can distinguish between patients with a good or from patients with bad prognosis when deciding to assign a patient to a therapy.
The predictive signatures are able to predict treatment benefit between experimental and/or nontraditional treatment groups vs. control, i.e. in clinical trials (Michiels, Ternès, and Rotolo 2016).
The diagnostic signature, also called biomarkers can be used for detection of a disease in a patient, like for example in blood tests.
The specific signatures should describe with robustness and reproducibility the same group of cells, or patients, or condition with respect to other considered groups. For instance, in the context of cell-types, among studied cell-types a specific signature will distinguish only one cell type. In the context of cancer subtypes, it will indicate clearly one subtype among others.
Examples of predictive and prognostic gene signatures, used in clinical practice are Oncotype DX, EndoPredict, PAM50, and Breast Cancer Index for breast cancer (Harris et al. 2016).
Studies discussed in this Chapter showed plausible importance of immune-related signals in cancer therapy. However, there is no no immune-related gene signatures used in clinical practice currently. This can be because of the lack of consistency of genes, both within the same tumor type and among different tumors that can be found in the signatures (Chifman et al. 2016). Difference in gene expression of different cell populations were found even intra- and interlabs. This difference can be due to confounding factors like stress or to contamination (Heng et al. 2008).
In many studies specifc signatures of cell types are used. They seem to be good in discriminating between broad lineages of cell type, such as lymphoid and myeloid. Although thier capacity to describe cell states and cell subtypes is more discutable (Chifman et al. 2016). Another matter is that cell type signatures are often obtained in model organisms or extracted from different tissue (i.e. blood-derived signatures vs cancer-derived signatures).
the gene expression profiles of tumour-associated immune cells differ considerably from those of blood derived immune cells (Schelker et al. 2017)
With emergence of single-cell signatures, there are new horizons of gene signatures to be discovered. Especially signatures of rare cell types in solid tissues. Yet, it is up to researches to cross validate single cell signatures with different types of data as scRNA-seq is not free of platform and post-processing bias.
Immune signatures will be also discussed as a part of deconvolution pipeline in the Chapter 2 under the section about basis matrix in mathematical terms.
1.3.4 Cancer therapies
Cancer is a complex disease. Up to date, no uniform and fully effective treatment were proposed, and usually different strategies are tested to kill tumor cells. Surgery is one of the oldest methods. The cancer is removed from the patient body. There are different ways, more or less invasive, that it can be performed. It is usually applied for solid tumor contained in a small area. Radiation Therapy uses high doses of radiation to eliminate tumor cells and shrink tumor mass. It can be applied externally or internally. Chemotherapy uses a drug (or a combination of drugs) that kill cancer cells, usually altering cell proliferation and growth. The drawback of radiotherapy and chemotherapy are substantial side effects. Hormone therapy modulate hormone levels in the body in order to inhibit tumor growth in breast and prostate cancers. In leukemia and lymphoma, can be applied stem cell transplants that restore blood-forming stem cells destroyed by the very high doses of chemotherapy or radiation therapy that are used to treat certain cancers.
Alternatively, targeted therapies represent a more focused strategy that aims to be more efficient and cause fewer side effects than systematic therapies. Two main types of targeted therapies are small-molecule drugs and monoclonal antibodies. Targeted therapies usually aim to stimulate/inhibit a selected molecular function. Particular types of targeted therapies are Immunotherapies. Through activation/inhibition of immune regulatory pathways, it stimulates the immune system to destroy malignant cells. A continuation of targeted therapies is precision medicine approach. It is based on genetic information to specify patient’s profile and find a suitable treatment. A number of innovative treatments targeting a specific change in tumor ecosystem are being tested presently in precision medicine clinical trials (Institute 2017).
1.3.5 Recent progress in immuno-therapies
The immunotherapies, in contrast with other types of cancers therapies discussed in the previous section, aim to trigger or restart the immune system to defend the organism and attack the malignant cells without provoking persisting inflammation state (Predina et al. 2013)
The idea of stimulating the immune system to fight malignant cell was not born recently. For a long time, a possibility of development of an anti-cancer vaccine has been investigated. Unfortunately, this idea faced two essential limitations 1) lack of knowledge of antigens that should be used in a vaccine to stimulate cytotoxic T cells successfully) the ability of cancer to block the immune response also called immunostat. Despite those impediments works on anti-tumor vaccines do not cease (Palucka and Banchereau 2013). A very recent promising an in-situ anti-tumor vaccine was proposed by Sagiv-Barfi et al. (Sagiv-Barfi et al. 2018). The therapy tested in mice would be based on local injections of the combination of “unmethylated CG-enriched oligodeoxynucleotide (Cp-G) - a Toll-like receptor 9 (TLR9) ligand and anti-OX40 antibody. Low doses of CpG injected into a tumor induce the expression of OX40 on CD4+ T cells in the microenvironment in mouse or human tumors. An agonistic anti-OX40 antibody can then trigger a T cell immune response, which is specific to the antigens of the injected tumor”. Sagiv-Barfi et al. claim this therapy could be applied to all tumor types, as long as they are leucocyte-infiltrated. As a local therapy, in situ vaccination should have fewer side-effects than systematic administration. It is now undergoing clinical trials to test its efficiency in human patients.
Another idea involving using the immune system as a weapon to fight cancer would be the use of genetically modified patient’s T-cells, carrying CARs (chimeric antigen receptors) (Jackson, Rafiq, and Brentjens 2016). After an extended period of small unsuccessful trials, recently in 2017, two CAR T-cell therapies were accepted, one to “treat adults with certain type of large B-cell lymphoma” (Health and Services 2017b), other to treat “children with acute lymphoblastic leukemia (ALL)” (Health and Services 2017a), which are, at the same time, the first two gene therapies accepted by FDA.
However, the two most promising immuno-related strategies with proven clinical efficiency are based on blocking so-called immune checkpoint inhibitors: cytotoxic T-lymphocyte protein 4 (CTLA4) and programmed cell death protein 1 (PD-1). The anti-CLTA4 antibodies blocks repressive action of CLTA4 on T-cells and they become therefore activated. It was shown efficient in melanoma patients and accepted by FDA in 2015 as adjuvant therapy for stage III metastatic melanoma patients (Health and Services 2015). PD-1 is a cell surface receptor of T cells, that binds to PD-L1/PD-L2. After binding, an immunosuppressive pathway is activated and T cells activity is dampened. An action of an anti-PD-L1 antibody is to prevent this immune exhaustion (Chen and Mellman 2017). A stepping stone for anti-PD-L1 therapies was approval of Tecentriq (atezolizumab) for Bladder cancer (Health and Services 2016a) and anti-PD1 Keytruda (pembrolizumab) initially accepted for NSCLC and further extended to head and neck cancer, Hodgkin’s lymphoma, gastric cancer and microsatellite instability-high cancer (Health and Services 2016b). Since that breakthrough, other anti-PD-L1 or anti-PD1 antibodies were accepted or entered advanced stages of clinical trials (Wolchok 2015). A short history of immunotherapy FDA-accepted treatments can be found in Fig. 1.8
Figure 1.8: This timeline describes short history of FDA approval of checkpoint blocking immunotherapies up to 2017. Reprinted by permission from Springer Nature (Taube et al. 2017) Macmillan Publishers Limited, part of Springer Nature. All Rights Reserved.
The main drawback of immunotherapies is heterogeneity of response rate, which can vary, i.e., from 10–40% in case of PD-L1blocking (Zou, Wolchok, and Chen 2016), suggesting that some patients can have more chances than others to respond to immune therapy. So far, it has been shown that anti PD-L1 therapies work more effectively in T cell infiltrated tumors with the exclusion of Tregs because of lack of difference in expression of FOXP3 in responding and the non-responding group of patients (Herbst et al. 2014). Also, some light has been shade by Rizvi et al. (2015) who connected mutational rate of cancer cells to the chances of response to immunotherapy.
Despite those findings, the precise qualifications of patients that should be sensitive to immunotherapy are not defined (Pitt et al. 2016). As most patients do not answer to immunotherapies, it stimulates researches to look for better biomarkers and patient stratifications, and pharmaceutical industries to discover new immune checkpoints based therapies.
1.4 Summary of the chapter
Cancer remains a critical health problem of our era that touches many people. Tumor cells are interacting with their microenvironment (called Tumor Microenvironment (TME)) including normal cell, stromal cells and a variety of immune cells. These cells can have a role in disease progression and response to treatment. A modern approach to modulate TME was proposed through an application of immune therapies.
A new way to classify cancers based on their TME is called immunophenotyping. Widely used TCGA data contains many different data types, but not all of possible data types. Before entering a clinical practice, the immunophenotyping approaches will need to face important challenges. Would addition of a new data type (i.e., FACS) change the patients classification? Can the similar results be found in non-American patient cohorts? What if different technologies are used, if data are not normalized uniformly, would it change the conclusions? What if not all data types available in TCGA are not produced for other patients? How these classification can be reproduced for smaller cohorts? Can these complex classification schemes be reduced to a few easy measurable indices? It is important to acknowledge the authors for their remarkable work. However it is also crucial to remember we are biased by the piece of the truth (type of data) we use, that can be on the top biased with technical and experimental design.
To produce a very detailed system-level view of the TME with traditional experimental techniques an uncountable amount of work and resources would be necessary. Using omic techniques system approach is possible to reduce the time and resources. However, to embrace fully the data complexity, computational tools are indispensable. From the data generation to the analysis, different statistical and mathematical challenges need to be faced before arriving at valid biological results and interpretations.
As I will present in the next chapter, in order to solve the problem of extraction of cell-type heterogeneity from cancer bulk omic data, a number of approaches were developed.
References
Research in Cancer, International Agency for. 2018. “GLOBOCAN - Facts Sheets by Cancer.” http://globocan.iarc.fr/Pages/fact_sheets_cancer.aspx.
Sudhakar, Akulapalli. 2009. “History of Cancer, Ancient and Modern Treatment Methods.” J. Cancer Sci. Ther. 1 (2). NIH Public Access: 1–4. doi:10.4172/1948-5956.100000e2.
NPR. 2010b. “Science Diction: The Origin of the Word ’Cancer’ : NPR.” https://www.npr.org/templates/story/story.php?storyId=130754101.
Virchow Rudolf. 1847. “Archiv für pathologische Anatomie und Physiologie und für klinische Medizin.” Berlin ; New York: Springer. file://catalog.hathitrust.org/Record/000493993 http://hdl.handle.net/2027/njp.32101076036878 (Bd.64 (1875)) http://hdl.handle.net/2027/uc1.31175008645106 (v.170 {\&}index v.161-170) http://hdl.handle.net/2027/hvd.32044093331494 (Bd.111 (1888)) http://hdl.han.
Paget, Stephen. 1889. “THE DISTRIBUTION OF SECONDARY GROWTHS IN CANCER OF THE BREAST.” Lancet 133 (3421). Elsevier: 571–73. doi:10.1016/S0140-6736(00)49915-0.
Ehrlich, P. 1909. “Über den jetzigen Stand der Chemotherapie.” Berichte Der Dtsch. Chem. Gesellschaft 42 (1). Wiley-Blackwell: 17–47. doi:10.1002/cber.19090420105.
Greenblatt, M, and P Shubi. 1968. “Tumor angiogenesis: transfilter diffusion studies in the hamster by the transparent chamber technique.” J. Natl. Cancer Inst. 41 (1): 111–24. http://www.ncbi.nlm.nih.gov/pubmed/5662020.
Folkman, J, E Merler, C Abernathy, and G Williams. 1971. “Isolation of a tumor factor responsible for angiogenesis.” J. Exp. Med. 133 (2). Rockefeller University Press: 275–88. doi:10.1084/JEM.133.2.275.
Feinberg, Andrew P., and Bert Vogelstein. 1983. “Hypomethylation distinguishes genes of some human cancers from their normal counterparts.” Nature 301 (5895). Nature Publishing Group: 89–92. doi:10.1038/301089a0.
Greger, Valerie, Eberhard Passarge, Wolfgang H�pping, Elmar Messmer, and Bernhard Horsthemke. 1989. “Epigenetic changes may contribute to the formation and spontaneous regression of retinoblastoma.” Hum. Genet. 83 (2). Springer-Verlag: 155–58. doi:10.1007/BF00286709.
Van Pel, A, and T Boon. 1982. “Protection against a nonimmunogenic mouse leukemia by an immunogenic variant obtained by mutagenesis.” Proc. Natl. Acad. Sci. U. S. A. 79 (15): 4718–22. http://www.ncbi.nlm.nih.gov/pubmed/6981814 http://www.pubmedcentral.nih.gov/articlerender.fcgi?artid=PMC346748.
Leung, D., G Cachianes, W. Kuang, D. Goeddel, and N Ferrara. 1989. “Vascular endothelial growth factor is a secreted angiogenic mitogen.” Science (80-. ). 246 (4935): 1306–9. doi:10.1126/science.2479986.
Golub, T R, D K Slonim, P Tamayo, C Huard, M Gaasenbeek, J P Mesirov, H Coller, et al. 1999. “Molecular classification of cancer: class discovery and class prediction by gene expression monitoring.” Science 286 (5439). American Association for the Advancement of Science: 531–7. doi:10.1126/SCIENCE.286.5439.531.
Corlan, Alexandru Dan. 2004. “Medline Trend: Automated Yearly Statistics of Pubmed Results for Any Query.” http://dan.corlan.net/medline-trend.html.
Balkwill, Fran, and Alberto Mantovani. 2001. “Inflammation and cancer: Back to Virchow?” doi:10.1016/S0140-6736(00)04046-0.
Talmadge, J E, and D I Gabrilovich. 2013. “History of myeloid-derived suppressor cells.” Nat Rev Cancer 13 (10): 739–52. doi:10.1038/nrc3581.
Gabrilovich, Dmitry I., Suzanne Ostrand-Rosenberg, and Vincenzo Bronte. 2012. “Coordinated regulation of myeloid cells by tumours.” doi:10.1038/nri3175.
Taube, Janis M, Jérôme Galon, Lynette M Sholl, Scott J Rodig, Tricia R Cottrell, Nicolas A Giraldo, Alexander S Baras, et al. 2017. “Implications of the tumor immune microenvironment for staging and therapeutics.” Mod. Pathol. doi:10.1038/modpathol.2017.156.
Dumont, Nancy, Bob Liu, Rosa Anna DeFilippis, Hang Chang, Joseph T. Rabban, Anthony N. Karnezis, Judy A. Tjoe, James Marx, Bahram Parvin, and Thea D. Tlsty. 2013. “Breast Fibroblasts Modulate Early Dissemination, Tumorigenesis, and Metastasis through Alteration of Extracellular Matrix Characteristics.” Neoplasia 15 (3): 249–IN7. doi:10.1593/neo.121950.
Quail, D F, and J A Joyce. 2013. “Microenvironmental regulation of tumor progression and metastasis.” Nat Med 19 (11): 1423–37. doi:10.1038/nm.3394.
Hanahan, Douglas, and Lisa M. Coussens. 2012. “Accessories to the Crime: Functions of Cells Recruited to the Tumor Microenvironment.” Cancer Cell 21 (3): 309–22. doi:10.1016/j.ccr.2012.02.022.
Hanahan, D, and R A Weinberg. 2000. “The hallmarks of cancer.” Cell 100 (1). Elsevier: 57–70. doi:10.1016/S0092-8674(00)81683-9.
Sebeok, Thomas A. 1976. “DISCUSSION.” Ann. N. Y. Acad. Sci. 280 (1 Origins and E). Blackwell Publishing Ltd: 481. doi:10.1111/j.1749-6632.1976.tb25511.x.
Burnet, F M. 1970. “The concept of immunological surveillance.” Prog. Exp. Tumor Res. 13: 1–27. http://www.ncbi.nlm.nih.gov/pubmed/4921480.
Dunn, Gavin P., Allen T. Bruce, Hiroaki Ikeda, Lloyd J. Old, and Robert D. Schreiber. 2002. “Cancer immunoediting: from immunosurveillance to tumor escape.” Nat. Immunol. 3 (11). Nature Publishing Group: 991–98. doi:10.1038/ni1102-991.
Vesely, Matthew D., Michael H. Kershaw, Robert D. Schreiber, and Mark J. Smyth. 2011. “Natural Innate and Adaptive Immunity to Cancer.” Annu. Rev. Immunol. 29 (1): 235–71. doi:10.1146/annurev-immunol-031210-101324.
Marquez-Medina, Diego, Joel Salla-Fortuny, and Antonieta Salud-Salvia. 2012. “Role of gamma-delta T-cells in cancer. Another opening door to immunotherapy.” Clin. Transl. Oncol. 14 (12): 891–95. doi:10.1007/s12094-012-0935-7.
Kornstein, M J, J S Brooks, and D E Elder. 1983. “Immunoperoxidase localization of lymphocyte subsets in the host response to melanoma and nevi.” Cancer Res. 43 (6): 2749–53. http://www.ncbi.nlm.nih.gov/pubmed/6342758.
Baxevanis, C N, G V Dedoussis, N G Papadopoulos, I Missitzis, G P Stathopoulos, and M Papamichail. 1994. “Tumor specific cytolysis by tumor infiltrating lymphocytes in breast cancer.” Cancer 74 (4): 1275–82. http://www.ncbi.nlm.nih.gov/pubmed/7914469.
Naito, Y, K Saito, K Shiiba, A Ohuchi, K Saigenji, H Nagura, and H Ohtani. 1998. “CD8+ T cells infiltrated within cancer cell nests as a prognostic factor in human colorectal cancer.” Cancer Res. 58 (16): 3491–4. http://www.ncbi.nlm.nih.gov/pubmed/9721846.
Pagès, Franck, Anne Berger, Matthieu Camus, Fatima Sanchez-Cabo, Anne Costes, Robert Molidor, Bernhard Mlecnik, et al. 2005. “Effector Memory T Cells, Early Metastasis, and Survival in Colorectal Cancer.” N. Engl. J. Med. 353 (25): 2654–66. doi:10.1056/NEJMoa051424.
Aris, Mariana, María Marcela Barrio, and José Mordoh. 2012. “Lessons from Cancer Immunoediting in Cutaneous Melanoma.” Clin. Dev. Immunol. 2012: 1–14. doi:10.1155/2012/192719.
Bhatia, Alka, and Yashwant Kumar. 2011. “Cancer-immune equilibrium: questions unanswered.” Cancer Microenviron. 4 (2). Springer: 209–17. doi:10.1007/s12307-011-0065-8.
Teng, Michele W. L., Jeremy B. Swann, Catherine M. Koebel, Robert D. Schreiber, and Mark J. Smyth. 2008. “Immune-mediated dormancy: an equilibrium with cancer.” J. Leukoc. Biol. 84 (4): 988–93. doi:10.1189/jlb.1107774.
Frey, Daniel M., Raoul A. Droeser, Carsten T. Viehl, Inti Zlobec, Alessandro Lugli, Urs Zingg, Daniel Oertli, Christoph Kettelhack, Luigi Terracciano, and Luigi Tornillo. 2010. “High frequency of tumor-infiltrating FOXP3+ regulatory T cells predicts improved survival in mismatch repair-proficient colorectal cancer patients.” Int. J. Cancer 126 (11): 2635–43. doi:10.1002/ijc.24989.
Qian, Bin Z., and Jeffrey W. Pollard. 2010. “Macrophage Diversity Enhances Tumor Progression and Metastasis.” doi:10.1016/j.cell.2010.03.014.
Stewart, T., S. CJ Tsai, H. Grayson, R. Henderson, and G. Opelz. 1995. “Incidence of de-novo breast cancer in women chronically immunosuppressed after organ transplantation.” Lancet 346 (8978): 796–98. doi:10.1016/S0140-6736(95)91618-0.
Boal, David H. 2002. Mechanics of the cell. Cambridge University Press.
Slater, Matthew H. 2013. “Cell Types as Natural Kinds.” Biol. Theory 7 (2). Springer Netherlands: 170–79. doi:10.1007/s13752-012-0084-9.
Satija, Rahul, and Alex K. Shalek. 2014. “Heterogeneity in immune responses: from populations to single cells.” Trends Immunol. 35 (5): 219–29. doi:10.1016/j.it.2014.03.004.
Ediorial Cell Systems. 2017. “What Is Your Conceptual Definition of ‘Cell Type’ in the Context of a Mature Organism?” Cell Syst. 4 (3). Elsevier: 255–59. doi:10.1016/j.cels.2017.03.006.
Ponting, Chris P. 2017. “Big knowledge from big data in functional genomics.” Emerg. Top. Life Sci. 1 (3). Portland Press Journals portal: 245–48. doi:10.1042/ETLS20170129.
Papalexi, Efthymia, and Rahul Satija. 2017. “Single-cell RNA sequencing to explore immune cell heterogeneity.” Nat. Rev. Immunol. 18 (1): 35–45. doi:10.1038/nri.2017.76.
Lyons, Yasmin A, Sherry Y Wu, Willem W Overwijk, Keith A Baggerly, and Anil K Sood. 2017. “Immune cell profiling in cancer: molecular approaches to cell- specific identification.” Npj Precis. Oncol. 1. doi:10.1038/s41698-017-0031-0.
NPR. 2010a. “Science Diction: The Origin of the Word ’Cancer’.” https://www.npr.org/templates/story/story.php?storyId=130754101.
Giesen, Charlotte, Hao A O Wang, Denis Schapiro, Nevena Zivanovic, Andrea Jacobs, Bodo Hattendorf, Peter J Schüffler, et al. 2014. “Highly multiplexed imaging of tumor tissues with subcellular resolution by mass cytometry.” Nat. Methods 11 (4). Nature Publishing Group: 417–22. doi:10.1038/nmeth.2869.
Schelker, Max, Sonia Feau, Jinyan Du, Nav Ranu, Edda Klipp, Birgit Schoeberl, Gavin MacBeath, et al. 2017. “Estimation of immune cell content in tumour tissue using single-cell RNA-seq data.” Nat. Commun. 8 (1). Nature Publishing Group: 2032. doi:10.1038/s41467-017-02289-3.
Wilczynski, Sharon P. 2009. “Molecular Biology.” In Mod. Surg. Pathol., 85–120. Elsevier. doi:10.1016/B978-1-4160-3966-2.00006-0.
Velculescu, V E, L Zhang, W Zhou, J Vogelstein, M A Basrai, D E Bassett, P Hieter, B Vogelstein, and K W Kinzler. 1997. “Characterization of the yeast transcriptome.” Cell 88 (2): 243–51. http://www.ncbi.nlm.nih.gov/pubmed/9008165.
Cieślik, Marcin, and Arul M. Chinnaiyan. 2017. “Cancer transcriptome profiling at the juncture of clinical translation.” Nat. Rev. Genet. 19 (2). Nature Publishing Group: 93–109. doi:10.1038/nrg.2017.96.
Chen, Xi, Sarah A. Teichmann, and Kerstin B. Meyer. 2018. “From Tissues to Cell Types and Back: Single-Cell Gene Expression Analysis of Tissue Architecture.” Annu. Rev. Biomed. Data Sci. 1 (1). Annual Reviews: 29–51. doi:10.1146/annurev-biodatasci-080917-013452.
Mody, Rajen J., Yi-Mi Wu, Robert J. Lonigro, Xuhong Cao, Sameek Roychowdhury, Pankaj Vats, Kevin M. Frank, et al. 2015. “Integrative Clinical Sequencing in the Management of Refractory or Relapsed Cancer in Youth.” JAMA 314 (9). American Medical Association: 913. doi:10.1001/jama.2015.10080.
Oberg, Jennifer A., Julia L. Glade Bender, Maria Luisa Sulis, Danielle Pendrick, Anthony N. Sireci, Susan J. Hsiao, Andrew T. Turk, et al. 2016. “Implementation of next generation sequencing into pediatric hematology-oncology practice: moving beyond actionable alterations.” Genome Med. 8 (1). BioMed Central: 133. doi:10.1186/s13073-016-0389-6.
Robinson, Dan R., Yi-Mi Wu, Robert J. Lonigro, Pankaj Vats, Erin Cobain, Jessica Everett, Xuhong Cao, et al. 2017. “Integrative clinical genomics of metastatic cancer.” Nature 548 (7667). Nature Publishing Group: 297–303. doi:10.1038/nature23306.
Chen, Pei Ling, Whijae Roh, Alexandre Reuben, Zachary A. Cooper, Christine N. Spencer, Peter A. Prieto, John P. Miller, et al. 2016. “Analysis of immune signatures in longitudinal tumor samples yields insight into biomarkers of response and mechanisms of resistance to immune checkpoint blockade.” Cancer Discov. 6 (8): 827–37. doi:10.1158/2159-8290.CD-15-1545.
Perkel, Jeffrey M. 2017. “Single-cell sequencing made simple.” Nature 547 (7661): 125–26. doi:10.1038/547125a.
Davis, Sean. 2016. “Github: Awesome-Single-Cell.” https://github.com/seandavi/awesome-single-cell.
Core, Cedar-Sinals Genomics. 2016. “Single Cell Genomics.” https://www.cedars-sinai.edu/Research/Research-Cores/Genomics-Core/Documents/website_pricing_jan_2018_final.pdf.
Tirosh, Itay, Benjamin Izar, Sanjay M. Prakadan, Marc H. Wadsworth, Daniel Treacy, John J. Trombetta, Asaf Rotem, et al. 2016. “Dissecting the multicellular ecosystem of metastatic melanoma by single-cell RNA-seq.” Science (80-. ). 352 (6282): 189–96. doi:10.1126/science.aad0501.
Bernstein, Bradley E, Alexander Meissner, and Eric S Lander. 2007. “The mammalian epigenome.” Cell 128 (4). Elsevier: 669–81. doi:10.1016/j.cell.2007.01.033.
Jeschke, Jana, Martin Bizet, Christine Desmedt, Emilie Calonne, Sarah Dedeurwaerder, Soizic Garaud, Alexander Koch, et al. 2017. “DNA methylation–based immune response signature improves patient diagnosis in multiple cancers.” J. Clin. Invest. 127 (8): 3090–3102. doi:10.1172/JCI91095.
McCarroll, Steven A, and David M Altshuler. 2007. “Copy-number variation and association studies of human disease.” Nat. Genet. 39 (7s): S37–S42. doi:10.1038/ng2080.
Zarrei, Mehdi, Jeffrey R. MacDonald, Daniele Merico, and Stephen W. Scherer. 2015. “A copy number variation map of the human genome.” Nat. Rev. Genet. 16 (3): 172–83. doi:10.1038/nrg3871.
Yamamoto, Toshiyuki, Keiko Shimojima, Yumiko Ondo, Katsumi Imai, Pin Fee Chong, Ryutaro Kira, Mitsuhiro Amemiya, Akira Saito, and Nobuhiko Okamoto. 2016. “Challenges in detecting genomic copy number aberrations using next-generation sequencing data and the eXome Hidden Markov Model: a clinical exome-first diagnostic approach.” Hum. Genome Var. 3 (1). Nature Publishing Group: 16025. doi:10.1038/hgv.2016.25.
Ståhl, Patrik L, Fredrik Salmén, Sanja Vickovic, Anna Lundmark, José Fernández Navarro, Jens Magnusson, Stefania Giacomello, et al. 2016. “Visualization and analysis of gene expression in tissue sections by spatial transcriptomics.” Science 353 (6294). American Association for the Advancement of Science: 78–82. doi:10.1126/science.aaf2403.
Svensson, Valentine, Sarah A Teichmann, and Oliver Stegle. 2018. “SpatialDE: identification of spatially variable genes.” Nat. Methods 15 (5). Nature Publishing Group: 343–46. doi:10.1038/nmeth.4636.
Moncada, Reuben, Florian Wagner, Marta Chiodin, Joseph C. Devlin, Maayan Baron, Cristina H. Hajdu, Diane Simeone, and Itai Yanai. 2018. “Building a tumor atlas: integrating single-cell RNA-Seq data with spatial transcriptomics in pancreatic ductal adenocarcinoma.” bioRxiv, March. Cold Spring Harbor Laboratory, 254375. doi:10.1101/254375.
Galon, Jérôme, Bernhard Mlecnik, Gabriela Bindea, Helen K Angell, Anne Berger, Christine Lagorce, Alessandro Lugli, et al. 2014. “Towards the introduction of the ‘Immunoscore’ in the classification of malignant tumours.” J. Pathol. 232 (2): 199–209. doi:10.1002/path.4287.
Parker, Joel S, Michael Mullins, Maggie C U Cheang, Samuel Leung, David Voduc, Tammi Vickery, Sherri Davies, et al. 2009. “Supervised risk predictor of breast cancer based on intrinsic subtypes.” J. Clin. Oncol. 27 (8). American Society of Clinical Oncology: 1160–7. doi:10.1200/JCO.2008.18.1370.
Bindea, Gabriela, Bernhard Mlecnik, Marie Tosolini, Amos Kirilovsky, Maximilian Waldner, Anna C. Obenauf, Helen Angell, et al. 2013. “Spatiotemporal Dynamics of Intratumoral Immune Cells Reveal the Immune Landscape in Human Cancer.” Immunity 39 (4): 782–95. doi:10.1016/j.immuni.2013.10.003.
Berghoff, Anna, Jakob Kather, and Dirk Jäger. 2018. “Genetics and Immunology: Tumor-Specific Genetic Alterations as a Target for Immune Modulating Therapies.” In Oncoimmunology : A Practical Guide for Cancer Immunotherapy, edited by Laurence Zitvogel and Guido Kroemer, 231–46.
Chen, Daniel S., and Ira Mellman. 2017. “Elements of cancer immunity and the cancer-immune set point.” doi:10.1038/nature21349.
Herbst, Roy S., Jean-Charles Soria, Marcin Kowanetz, Gregg D. Fine, Omid Hamid, Michael S. Gordon, Jeffery A. Sosman, et al. 2014. “Predictive correlates of response to the anti-PD-L1 antibody MPDL3280A in cancer patients.” Nature 515 (7528): 563–67. doi:10.1038/nature14011.
Becht, Etienne, Aurélien de Reyniès, Nicolas A Giraldo, Camilla Pilati, Bénédicte Buttard, Laetitia Lacroix, Janick Selves, Catherine Sautès-Fridman, Pierre Laurent-Puig, and Wolf Herman Fridman. 2016. “Immune and Stromal Classification of Colorectal Cancer Is Associated with Molecular Subtypes and Relevant for Precision Immunotherapy.” Clin. Cancer Res. 22 (16). American Association for Cancer Research: 4057–66. doi:10.1158/1078-0432.CCR-15-2879.
Gajewski, Thomas F., Yuru Meng, Christian Blank, Ian Brown, Aalok Kacha, Justin Kline, and Helena Harlin. 2006. “Immune resistance orchestrated by the tumor microenvironment.” Immunol. Rev. 213 (1). Blackwell Publishing Ltd: 131–45. doi:10.1111/J.1600-065X.2006.00442.X.
Galon, Jérôme, Franck Pagès, Francesco M Marincola, Magdalena Thurin, Giorgio Trinchieri, Bernard A Fox, Thomas F Gajewski, and Paolo A Ascierto. 2012. “The immune score as a new possible approach for the classification of cancer.” J. Transl. Med. 10 (1). BioMed Central: 1. doi:10.1186/1479-5876-10-1.
Anitei, M G, G Zeitoun, B Mlecnik, F Marliot, N Haicheur, A M Todosi, A Kirilovsky, et al. 2014. “Prognostic and predictive values of the immunoscore in patients with rectal cancer.” Clin Cancer Res 20 (7): 1891–9. doi:10.1158/1078-0432.ccr-13-2830.
Pagès, Franck, Bernhard Mlecnik, Florence Marliot, Gabriela Bindea, Fang-Shu Ou, Carlo Bifulco, Alessandro Lugli, et al. 2018. “International validation of the consensus Immunoscore for the classification of colon cancer: a prognostic and accuracy study.” Lancet (London, England) 391 (10135). Elsevier: 2128–39. doi:10.1016/S0140-6736(18)30789-X.
“Sequential liquid biopsies reveal dynamic alterations of EGFR driver mutations and indicate EGFR amplification as a new mechanism of resistance to osimertinib in NSCLC.” 2017. Lung Cancer 108. Elsevier: 238–41. doi:10.1016/j.lungcan.2017.04.004.
Charoentong, Pornpimol, Francesca Finotello, Mihaela Angelova, Clemens Mayer, Mirjana Efremova, Dietmar Rieder, Hubert Hackl, and Zlatko Trajanoski. 2017. “Pan-cancer Immunogenomic Analyses Reveal Genotype-Immunophenotype Relationships and Predictors of Response to Checkpoint Blockade.” Cell Rep. 18 (1). Elsevier: 248–62. doi:10.1016/j.celrep.2016.12.019.
Angelova, Mihaela, Pornpimol Charoentong, Hubert Hackl, Maria L Fischer, Rene Snajder, Anne M Krogsdam, Maximilian J Waldner, et al. 2015. “Characterization of the immunophenotypes and antigenomes of colorectal cancers reveals distinct tumor escape mechanisms and novel targets for immunotherapy.” Genome Biol. 16 (1). BioMed Central: 64. doi:10.1186/s13059-015-0620-6.
Blank, Christian U, John B Haanen, Antoni Ribas, and Ton N Schumacher. 2016. “CANCER IMMUNOLOGY. the ‘Cancer Immunogram’.” Science 352 (6286). American Association for the Advancement of Science: 658–60. doi:10.1126/science.aaf2834.
Thorsson, Vésteinn, David L Gibbs, Scott D Brown, Denise Wolf, Dante S Bortone, Tai-Hsien Ou Yang, Eduard Porta-Pardo, et al. 2018. “The Immune Landscape of Cancer.” Immunity 48 (4). Elsevier: 812–830.e14. doi:10.1016/j.immuni.2018.03.023.
Tamborero, David, Carlota Rubio-Perez, Ferran Muinos, Radhakrishnan Sabarinathan, Josep Maria Piulats, Aura Muntasell, Rodrigo Dienstmann, Nuria Lopez-Bigas, and Abel Gonzalez-Perez. 2018. “A pan-cancer landscape of interactions between solid tumors and infiltrating immune cell populations.” Clin. Cancer Res. American Association for Cancer Research, clincanres.3509.2017. doi:10.1158/1078-0432.CCR-17-3509.
Hänzelmann, Sonja, Robert Castelo, and Justin Guinney. 2013. “GSVA: gene set variation analysis for microarray and RNA-Seq data.” BMC Bioinformatics 14 (1). BioMed Central: 7. doi:10.1186/1471-2105-14-7.
Kuperstein, Inna, David PA Cohen, Stuart Pook, Eric Viara, Laurence Calzone, Emmanuel Barillot, and Andrei Zinovyev. 2013. “NaviCell: a web-based environment for navigation, curation and maintenance of large molecular interaction maps.” BMC Syst. Biol. 7 (1). BioMed Central: 100. doi:10.1186/1752-0509-7-100.
Kuperstein, I, E Bonnet, H-A Nguyen, D Cohen, E Viara, L Grieco, S Fourquet, et al. 2015. “Atlas of Cancer Signalling Network: a systems biology resource for integrative analysis of cancer data with Google Maps.” Oncogenesis 4 (7): e160–e160. doi:10.1038/oncsis.2015.19.
Costa, Ana, Yann Kieffer, Alix Scholer-Dahirel, Floriane Pelon, Brigitte Bourachot, Melissa Cardon, Philemon Sirven, et al. 2018. “Fibroblast Heterogeneity and Immunosuppressive Environment in Human Breast Cancer.” Cancer Cell 33 (3). Elsevier: 463–479.e10. doi:10.1016/j.ccell.2018.01.011.
Győrffy, Balázs, Christos Hatzis, Tara Sanft, Erin Hofstatter, Bilge Aktas, and Lajos Pusztai. 2015. “Multigene prognostic tests in breast cancer: past, present, future.” Breast Cancer Res. 17 (1). BioMed Central: 11. doi:10.1186/s13058-015-0514-2.
Ross, J. S., C. Hatzis, W. F. Symmans, L. Pusztai, and G. N. Hortobagyi. 2008. “Commercialized Multigene Predictors of Clinical Outcome for Breast Cancer.” Oncologist 13 (5): 477–93. doi:10.1634/theoncologist.2007-0248.
Gnjatic, Sacha, Vincenzo Bronte, Laura Rosa Brunet, Marcus O Butler, Mary L Disis, Jérôme Galon, Leif G Hakansson, et al. 2017. “Identifying baseline immune-related biomarkers to predict clinical outcome of immunotherapy.” J. Immunother. Cancer 5. BioMed Central: 44. doi:10.1186/s40425-017-0243-4.
Itadani, Hiraku, Shinji Mizuarai, and Hidehito Kotani. 2008. “Can Systems Biology Understand Pathway Activation? Gene Expression Signatures as Surrogate Markers for Understanding the Complexity of Pathway Activation.” Curr. Genomics 9 (5): 349–60. doi:10.2174/138920208785133235.
Liu, Jiangang, Andrew Campen, Shuguang Huang, Sheng-Bin Peng, Xiang Ye, Mathew Palakal, A Keith Dunker, Yuni Xia, and Shuyu Li. 2008. “Identification of a gene signature in cell cycle pathway for breast cancer prognosis using gene expression profiling data.” BMC Med. Genomics 1 (1): 39. doi:10.1186/1755-8794-1-39.
Heng, Tracy S P, Michio W Painter, Kutlu Elpek, Veronika Lukacs-Kornek, Nora Mauermann, Shannon J Turley, Daphne Koller, et al. 2008. “The Immunological Genome Project: networks of gene expression in immune cells.” Nat. Immunol. 9 (10): 1091–4. doi:10.1038/ni1008-1091.
Vandenbon, Alexis, Viet H Dinh, Norihisa Mikami, Yohko Kitagawa, Shunsuke Teraguchi, Naganari Ohkura, and Shimon Sakaguchi. 2016. “Immuno-Navigator, a batch-corrected coexpression database, reveals cell type-specific gene networks in the immune system.” Proc. Natl. Acad. Sci. U. S. A. 113 (17). National Academy of Sciences: E2393–402. doi:10.1073/pnas.1604351113.
Godec, Jernej, Yan Tan, Arthur Liberzon, Pablo Tamayo, Sanchita Bhattacharya, Atul J. Butte, Jill P. Mesirov, and W. Nicholas Haining. 2016. “Compendium of Immune Signatures Identifies Conserved and Species-Specific Biology in Response to Inflammation.” Immunity 44 (1): 194–206. doi:10.1016/j.immuni.2015.12.006.
Subramanian, Aravind, Pablo Tamayo, Vamsi K Mootha, Sayan Mukherjee, Benjamin L Ebert, Michael A Gillette, Amanda Paulovich, et al. 2005. “Gene set enrichment analysis: a knowledge-based approach for interpreting genome-wide expression profiles.” Proc. Natl. Acad. Sci. U. S. A. 102 (43). National Academy of Sciences: 15545–50. doi:10.1073/pnas.0506580102.
Michiels, S., N. Ternès, and F. Rotolo. 2016. “Statistical controversies in clinical research: prognostic gene signatures are not (yet) useful in clinical practice.” Ann. Oncol. 27 (12): 2160–7. doi:10.1093/annonc/mdw307.
Harris, Lyndsay N., Nofisat Ismaila, Lisa M. McShane, Fabrice Andre, Deborah E. Collyar, Ana M. Gonzalez-Angulo, Elizabeth H. Hammond, et al. 2016. “Use of Biomarkers to Guide Decisions on Adjuvant Systemic Therapy for Women With Early-Stage Invasive Breast Cancer: American Society of Clinical Oncology Clinical Practice Guideline.” J. Clin. Oncol. 34 (10): 1134–50. doi:10.1200/JCO.2015.65.2289.
Chifman, Julia, Ashok Pullikuth, Jeff W Chou, Davide Bedognetti, and Lance D Miller. 2016. “Conservation of immune gene signatures in solid tumors and prognostic implications.” BMC Cancer 16 (1): 911. doi:10.1186/s12885-016-2948-z.
Institute, National Cancer. 2017. “Types of Cancer Treatment.” https://www.cancer.gov/about-cancer/treatment/types.
Predina, J., E. Eruslanov, B. Judy, V. Kapoor, G. Cheng, L.-C. Wang, J. Sun, et al. 2013. “Changes in the local tumor microenvironment in recurrent cancers may explain the failure of vaccines after surgery.” Proc. Natl. Acad. Sci. 110 (5): E415–E424. doi:10.1073/pnas.1211850110.
Palucka, Karolina, and Jacques Banchereau. 2013. “Dendritic-Cell-Based Therapeutic Cancer Vaccines.” doi:10.1016/j.immuni.2013.07.004.
Sagiv-Barfi, Idit, Debra K. Czerwinski, Shoshana Levy, Israt S. Alam, Aaron T. Mayer, Sanjiv S. Gambhir, and Ronald Levy. 2018. “Eradication of spontaneous malignancy by local immunotherapy.” Sci. Transl. Med. 10 (426). American Association for the Advancement of Science: eaan4488. doi:10.1126/SCITRANSLMED.AAN4488.
Jackson, Hollie J., Sarwish Rafiq, and Renier J. Brentjens. 2016. “Driving CAR T-cells forward.” doi:10.1038/nrclinonc.2016.36.
Health, U.S. Department of, and Human Services. 2015. “FDA Approves Yervoy to Reduce the Risk of Melanoma Returning After Surgery.” https://www.fda.gov/NewsEvents/Newsroom/PressAnnouncements/ucm469944.htm.
2016a. “FDA Approves New, Targeted Treatment for Bladder Cancer.” https://www.fda.gov/newsevents/newsroom/pressannouncements/ucm501762.htm. 2016b. “Pembrolizumab (Keytruda) Checkpoint Inhibitor.” https://www.fda.gov/drugs/informationondrugs/approveddrugs/ucm526430.htm. 2017a. “FDA Approval Brings First Gene Therapy to the United States.” https://www.fda.gov/NewsEvents/Newsroom/PressAnnouncements/ucm574058.htm. 2017b. “FDA Approves Car-T Cell Therapy to Treat Adults with Certain Types of Large B-Cell Lymphoma.” https://www.fda.gov/newsevents/newsroom/pressannouncements/ucm581216.htm.Health, U.S. Department of, and Human Services. 2015. “FDA Approves Yervoy to Reduce the Risk of Melanoma Returning After Surgery.” https://www.fda.gov/NewsEvents/Newsroom/PressAnnouncements/ucm469944.htm.
2016a. “FDA Approves New, Targeted Treatment for Bladder Cancer.” https://www.fda.gov/newsevents/newsroom/pressannouncements/ucm501762.htm. 2016b. “Pembrolizumab (Keytruda) Checkpoint Inhibitor.” https://www.fda.gov/drugs/informationondrugs/approveddrugs/ucm526430.htm. 2017a. “FDA Approval Brings First Gene Therapy to the United States.” https://www.fda.gov/NewsEvents/Newsroom/PressAnnouncements/ucm574058.htm.Health, U.S. Department of, and Human Services. 2015. “FDA Approves Yervoy to Reduce the Risk of Melanoma Returning After Surgery.” https://www.fda.gov/NewsEvents/Newsroom/PressAnnouncements/ucm469944.htm.
Health, U.S. Department of, and Human Services. 2015. “FDA Approves Yervoy to Reduce the Risk of Melanoma Returning After Surgery.” https://www.fda.gov/NewsEvents/Newsroom/PressAnnouncements/ucm469944.htm.
2016a. “FDA Approves New, Targeted Treatment for Bladder Cancer.” https://www.fda.gov/newsevents/newsroom/pressannouncements/ucm501762.htm.Health, U.S. Department of, and Human Services. 2015. “FDA Approves Yervoy to Reduce the Risk of Melanoma Returning After Surgery.” https://www.fda.gov/NewsEvents/Newsroom/PressAnnouncements/ucm469944.htm.
2016a. “FDA Approves New, Targeted Treatment for Bladder Cancer.” https://www.fda.gov/newsevents/newsroom/pressannouncements/ucm501762.htm. 2016b. “Pembrolizumab (Keytruda) Checkpoint Inhibitor.” https://www.fda.gov/drugs/informationondrugs/approveddrugs/ucm526430.htm.Wolchok, Jedd D. 2015. “PD-1 Blockers.” doi:10.1016/j.cell.2015.07.045.
Zou, Weiping, Jedd D. Wolchok, and Lieping Chen. 2016. “PD-L1 (B7-H1) and PD-1 pathway blockade for cancer therapy: Mechanisms, response biomarkers, and combinations.” Sci. Transl. Med. 8 (328). doi:10.1126/scitranslmed.aad7118.
Rizvi, Naiyer A., Matthew D. Hellmann, Alexandra Snyder, Pia Kvistborg, Vladimir Makarov, Jonathan J. Havel, William Lee, et al. 2015. “Mutational landscape determines sensitivity to PD-1 blockade in non-small cell lung cancer.” Science (80-. ). 348 (6230): 124–28. doi:10.1126/science.aaa1348.
Pitt, Jonathan M, Marie Vétizou, Romain Daillère, María Paula Roberti, Takahiro Yamazaki, Bertrand Routy, Patricia Lepage, et al. 2016. “Resistance Mechanisms to Immune-Checkpoint Blockade in Cancer: Tumor-Intrinsic and -Extrinsic Factors.” Immunity 44 (6). Elsevier: 1255–69. doi:10.1016/j.immuni.2016.06.001.